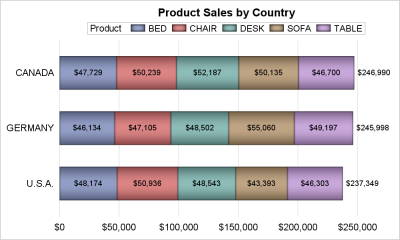
A common request on the communities page is to place data labels on horizontal bar charts. Often users want to display stacked horizontal bar charts, with the values displayed for each segment and the overall value of the bar itself as shown in the example below. In this example, the
Tag: FillHeight
HBar with Data Labels
Legendary
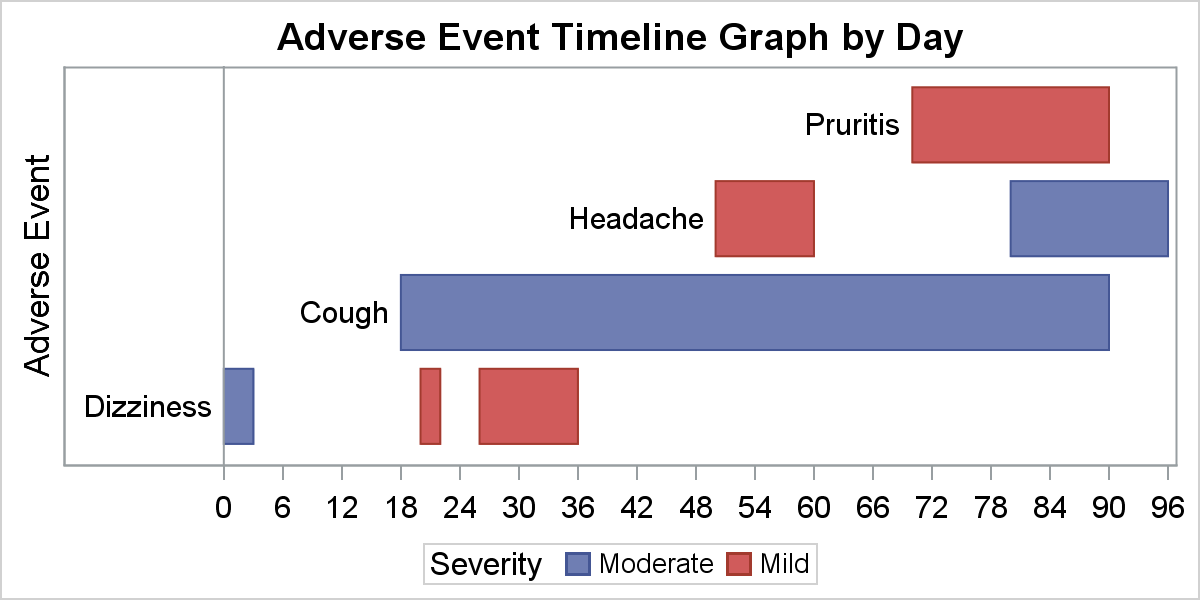
Entries in a legend are populated automatically based on the data. When creating a graph with group classification, the display attributes for each bar are derived from the GraphData1-12 style elements from the active style. The graph on the right shows you the result of creating an adverse event timeline
Customize Legend Entries - SAS 9.40M3
We all want to customize our graphs just so, and have our personal preferences. Over the past few releases SG Procedures and GTL have added options to customize the look and feel of our graphs. In this article, I will describe new ways in which you can customize your legends. We will also see some