Getting Started with SGPLOT - Part 5 - Histograms
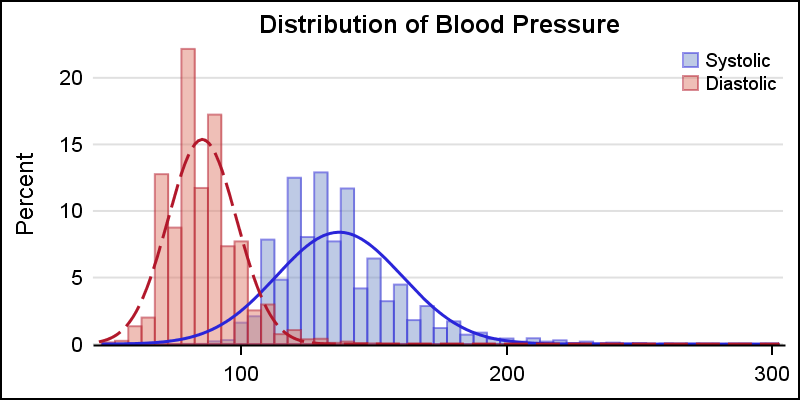
This is the 5th installment of the Getting Started series. The audience is the user who is new to the SG Procedures. Experienced users may also find some useful nuggets of information here. A histogram reveals features of the distribution of the analysis variable, such as its skewness and the peak which
