Tag: DAttrMap

Data Visualization | Learn SAS | Programming Tips
Sanjay Matange 0
Tips and tricks: Segmented discrete axis

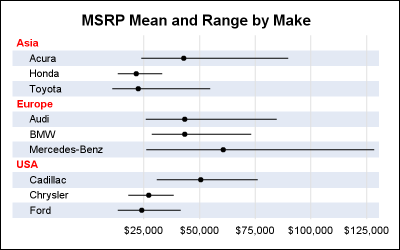
The previous post on Multiple Blank Categories showed how to include multiple blank categories on the axis.  But, given the purpose for this was to separate different segments in the data, I also included ideas on how to segmented a discrete axis using reference lines or Block Plot.  A similar idea

Data Visualization
Sanjay Matange 0
CandleStick Chart

A HighLow plot is very popular in the financial industry, often used to track the periodic movement of a stock or some instrument or commodity.  The CandleStick Chart is one specific type of high low plot, purportedly originating in Japan for tracking of financial instruments in the rice trade. Creating a