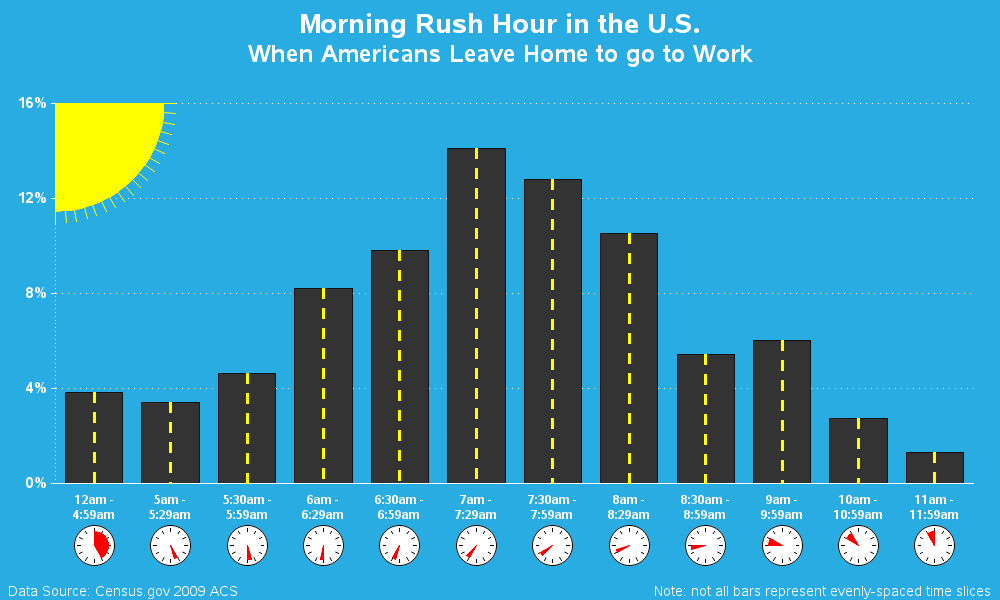
As the Research Triangle Park becomes more popular, we're getting a lot more traffic on the roads. And with flexible work hours, of course I try to pick a time to drive to work when there's less traffic. I recently saw a cool infographic showing the most popular times when
Tag: commute
Avoiding rush hour traffic!
Paint it black: A song choice or a graph background?
This blog post discusses the use of a black background in a graph. But before we get started, I invite you to have a listen to one of my favorite songs - "Paint it Black" by the Rolling Stones. Perhaps this song subliminally persuaded people to use black backgrounds in
What cities have the worst (and best) commute to work?
A while back, I had seen the following map on the CEOs for Cities website. It seemed like an interesting topic and an interesting map, but I just couldn't grok what their map was saying ... So I decided to download the data and create my own map with SAS. I