Analysis of clinical data is easier when the data is presented in a visual form. Clinical graphs have special requirements to deliver study data together in one concise graph, often with statistical information that is aligned with the data values on the x or y axis. SAS SG Procedures and GTL provide you the features you need to create effective clinical graphs. Also see “Clinical Graphs using SAS”, a SAS Press.
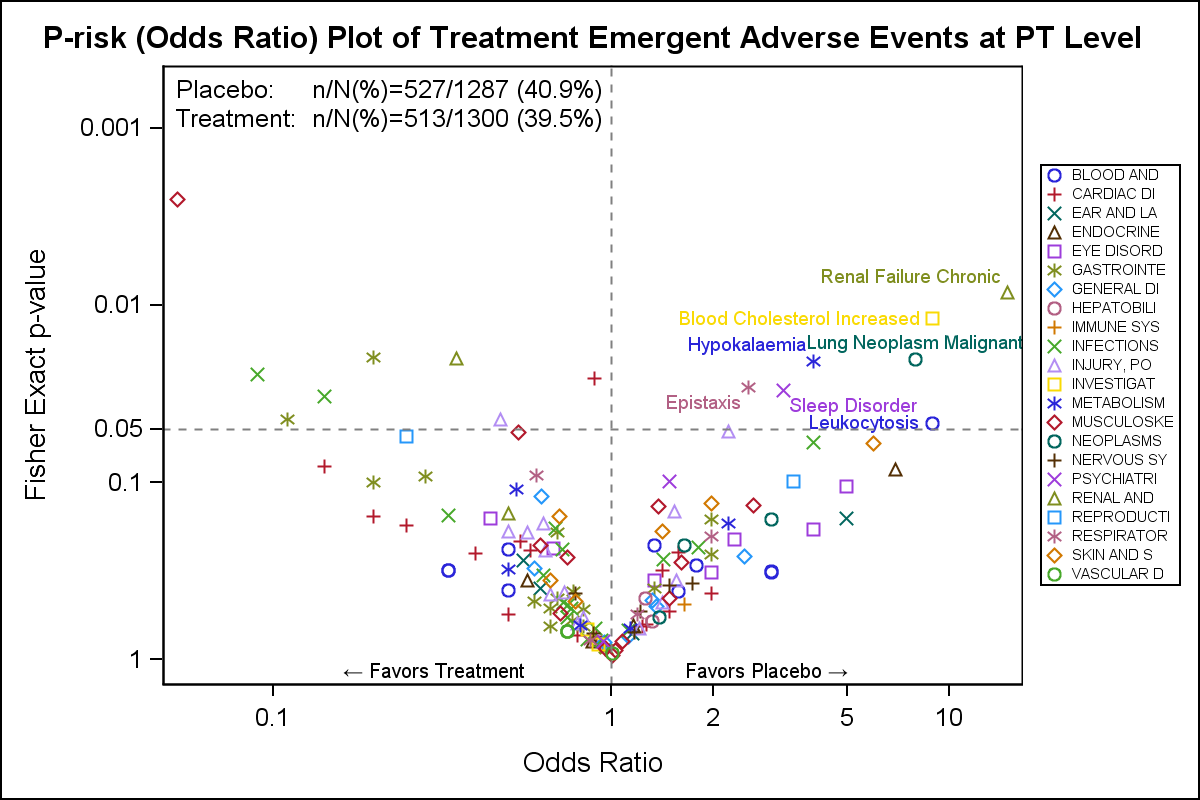
CTSPedia Clinical Graphs - Volcano Plot

A Volcano Plot is a type of scatter-plot that is used to quickly identify changes in large data sets composed of replicate data. In the clinical domain, a Volcano Plot is used to view Risk difference (RD) of AE occurrence (%) between drug and control by preferred term. One example of