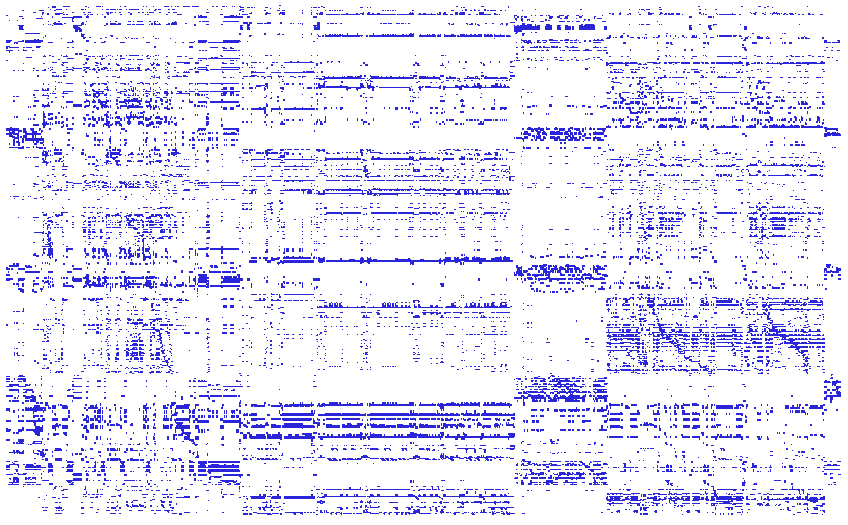
Finding the Beauty in Optimization Models - Visualizing MPS data sets
In 2013, Rick Wicklin blogged about visualizing matrices as heat maps using SAS/IML. That post reminded me that we had done a similar thing for the coefficient matrices in our optimization problems. In particular, we have developed some SAS macros to visualize the input data sets for the OPTLP (linear
