In his book, “The Unicorn Project,” Gene Kim presents five ideals that teams can use when embarking on their DevOps transformational journey. This post will explore the first ideal of “Locality and Simplicity.” We will examine it analytically to help understand why Kim suggests it as a good ideal to follow. The basis of this analysis will be through the lens of causation, rather than correlation. It will follow the principles outlined in a paper co-authored by Craig Statham and Stephen Walters (Field CTO at GitLab). By using graph theory for analysis, our paper “Value Stream Reference Architecture” (free subscription required to view) introduces how flow, impediments, needs, and energy (FINE) can be mapped mathematically by using a series of simple equations. This post will also share how the principles of Value Stream Reference Architecture (VSRA) can be used to understand why locality and simplicity are good ideals to follow.
The five ideals
In The Unicorn Project, the five ideals are:
- Locality and Simplicity
- Focus, Flow, and Joy
- Improvement of Daily Work
- Psychological Safety
- Customer Focus
These ideals are the five areas that Kim says he gravitated towards during his career in the IT industry. He suggests that they “seem to underpin what is required to create better value sooner, safer, and happier.” Kim further offers that these ideals are required to help organizations survive and win in the marketplace.
Locality and simplicity
This first ideal from The Unicorn Project is based on the idea that local optimizations are often more effective than global ones. It suggests that the more teams and individuals are empowered to do things for themselves, the more focus, flow, and joy they will have (as observed by the second ideal). Locality and simplicity mean that we need to design things so that we have locality in our systems and the organizations that design them.
The ideal considers the degree to which software teams can make code changes without impacting other teams. It also suggests that we need to ensure that internal complexity is avoided in our code, organizations, and processes. The ideal is based on the insight that Kim correlated from data that were created in observing tens of thousands of organizations across the globe in a highly scientific survey. This research is described in the book Accelerate and was used to create the State of DevOps reports, DORA, and the DevOps Handbook.
Locality and simplicity help create an efficient flow of value to the end consumer by reducing impediments and meeting the required user needs. All this without expending too much energy. By using the FINE flow equations, in combination with graph theory, we can observe the impact of locality and simplicity in a simple example.
Centralized sharing
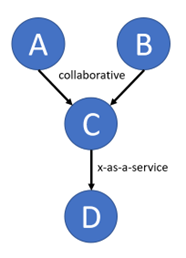
Figure 1 depicts a situation where a resource (team, individual, or system) is shared centrally between two consumers. The shared resource (node C) sits between the two consumers (node A and node B) and in turn consumes the resources of a downstream supplier (node D). The directed edges of this graph depict the dependencies that are in opposition to the flow of value. The complexity of the centralized node will be increased as it tries to jointly collaborate with both consumers while at the same time receiving the services of the downstream node.

The network of this graph is organizational and models the interactions between software development teams. For this example, we state that the interaction style between nodes A and C, and between nodes B and C is that of collaboration. Additionally, the interaction style between nodes C and D is that of as-a-service. These interaction styles are important when determining the cognitive load (energy) that is required at each node. They are mapped in the FINE analysis by attaching relative values to the edges of the graph and computing an average value seen at each node.
Additionally, PageRank centrality is used from graph theory to compute the relative value that each node has in the potential to impede flow. With values for energy and impediments computed, it is possible to mathematically determine the other two dimensions of flow and needs. An open source project is available on GitHub that can be used to compute these values.
The FINE values for the graph with centralized sharing are shown in Table 1.
| Node | Flow | Impediments | Needs | Energy |
| A | 2.3333 | 0.1378 | 0.3214 | 0.75 |
| B | 2.3333 | 0.1378 | 0.3214 | 0.75 |
| C | 1.0554 | 0.505 | 0.533 | 0.5625 |
| D | 1.0201 | 0.8408 | 0.8578 | 0.875 |
Table 1: FINE values with a centralized shared node
From this analysis, we can see that flow is the greatest and evenly shared in the two consumer nodes (nodes A and B). These two nodes have the same FINE values, as you might expect. The potential to impede flow is greatest in the downstream node (node D) but is also high in the centralized shared resource node (node C). These nodes with higher impedance will have the greatest impact on flow if they are unable to support the needs of the upstream nodes. We see that energy (cognitive load) is highest in the downstream node and least in the centralized shared node. The lower effort used by the centralized node will likely be a key indicator of the reduced flow in the consuming nodes.
Local dedicated resource
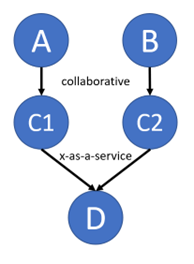
To improve local efficiency, we can subdivide the centralized shared resource into two separate dedicated nodes (nodes C1 and C2) that each support one of the upstream consumers. This results in a change to the graph where only the downstream node is now a shared resource. The new graph with local dedicated resources is shown in Figure 2.

By using the FINE flow analysis, we can ascertain the updated values for flow, impediments, needs, and energy that are observed for this new graph. The FINE values for the graph with localized dedicated resources are shown in Table 2.
| Node | Flow | Impediments | Needs | Energy |
| A | 2.5393 | 0.1163 | 0.2954 | 0.75 |
| B | 2.5393 | 0.1163 | 0.2954 | 0.75 |
| C1 | 1.4416 | 0.2807 | 0.4046 | 0.5833 |
| C2 | 1.4416 | 0.2807 | 0.4046 | 0.5833 |
| D | 0.9607 | 0.903 | 0.8675 | 0.8333 |
Table 2: FINE values with local dedicated nodes
We can see from the FINE values in the updated graph that the flow, in the consumer nodes (A and B), has increased from 2.3333 to 2.5393. In addition, the flow for the dedicated resource nodes has also increased when compared to the centralized and complex node of the previous graph (1.0554 to 1.4416). The flow has dropped slightly for the downstream node (node D). We can see the impediments for the downstream node increasing, which reflects its new importance to the total graph.
Overall, the flow of the graph has improved when localized and dedicated resources are used. This shows how sharing centralized and complex resources causes a reduction in the flow.
Summary
From this example, we can that the first ideal of locality and simplicity is indeed aimed toward the efficient flow of value to the end consumer. We can reason how this first ideal from Kim’s book has a parsimonious explanation that is more than just an intuitive notion. By using the methods of FINE Flow Analytics, we have shown the causal relationship of why locality and simplicity will eat centrality and complexity for breakfast.


