Security is everyone’s responsibility. Do you know how secure your products are? Can you quickly identify the top ten Open Web Application Security Project (OWASP) vulnerabilities in your applications? In this post, we will answer these and other security questions by demonstrating an automated shift-left CI/CD security workflow. This workflow tracks and reports the Dynamic Application Security Testing (DAST) security vulnerabilities in our application by using industry technologies. These include technologies such as Jenkins, Postgres, JIRA, Python, SQL, ZAP, and our own SAS products. We will show how the workflow makes our work more efficient, our product more secure, and most importantly, earns the confidence and trust of our customers. It is a win-win for everyone.
Challenges
Before SAS implemented an automated shift-left CI/CD security workflow, it wasn’t easy to know what the top OWASP vulnerabilities were without spending large amounts of time searching for and gathering information. Even then, the information might not be accurate or up to date. Additionally, there wasn't a way to know whether other applications have completed the DAST scans, nor was there a cohesive way to report and track vulnerabilities. To overcome those challenges, one of our design goals was to collect the DAST scan results, then use a SAS product stack to help report and analyze the security vulnerability status and trends. The eventual goal was to have the automated process learn and optimize false positives automatically over time. As we walk you through the implementation, we will also share how certain steps improved our work process. To learn more about the shift-left testing practice, visit Dzone.
Implementation
In our automated security workflow, we use OWASP ZAP to run security scans. In short, ZAP is an open source security tool that is widely accepted within communities around the world. It has strict compliance and security standards. We begin the process with the following steps:
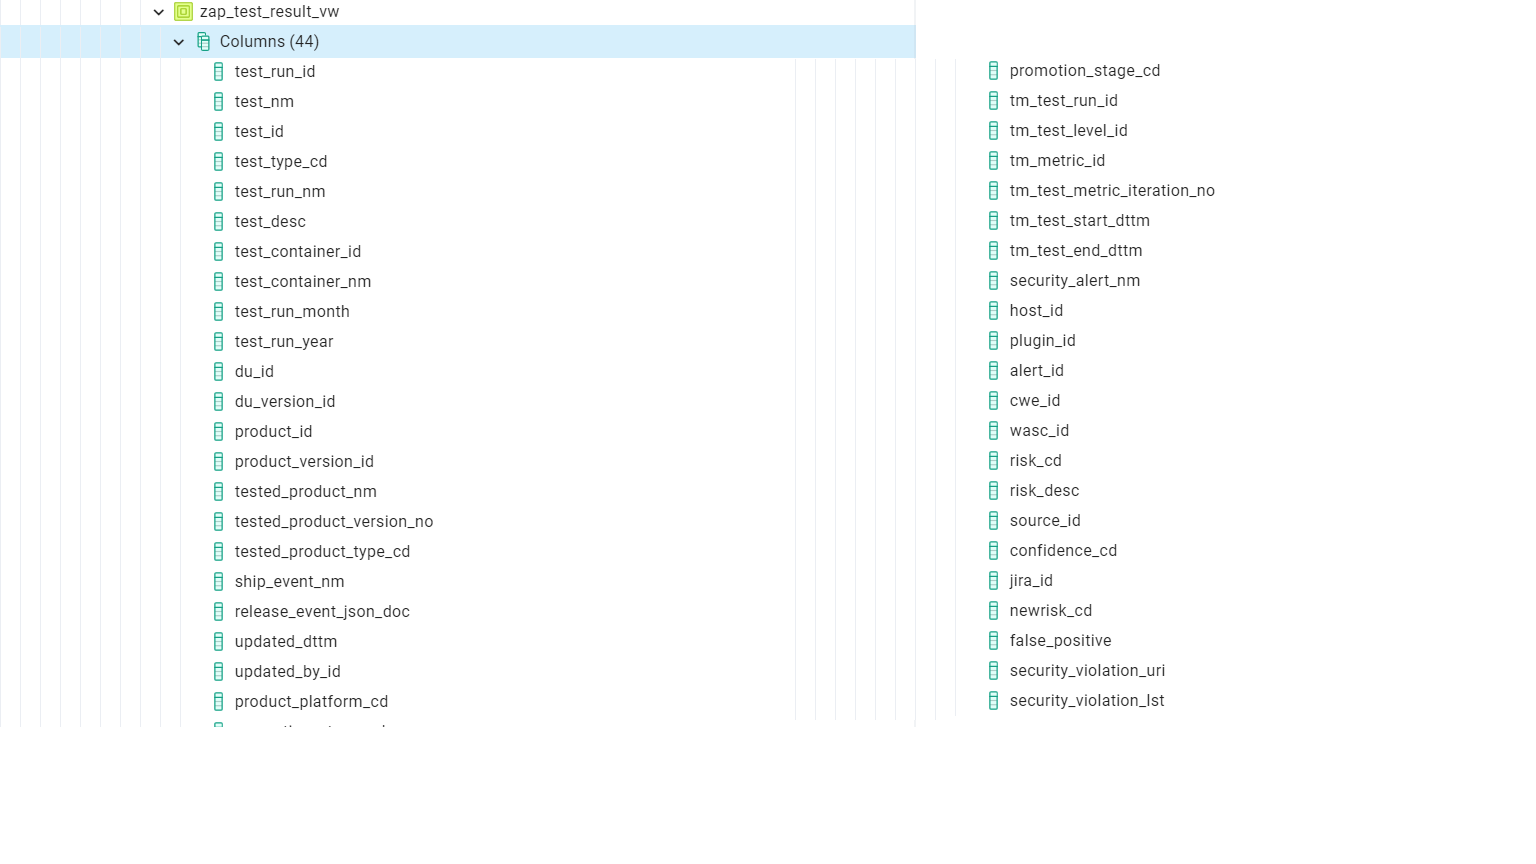
1. Design a schema and a view to store the security data in a shared Postgres database. Our internal name for this database is Continuous Quality Metrics (CQM). Some of the example data collected and stored in the CQM database tables are:
-
-
- test case name
- elapsed time
- product name
- release number
- and more (See Figure 1 for a snapshot of the database view)
-
2. Create a Python script to parse the contents of the security scan results into an XML format.
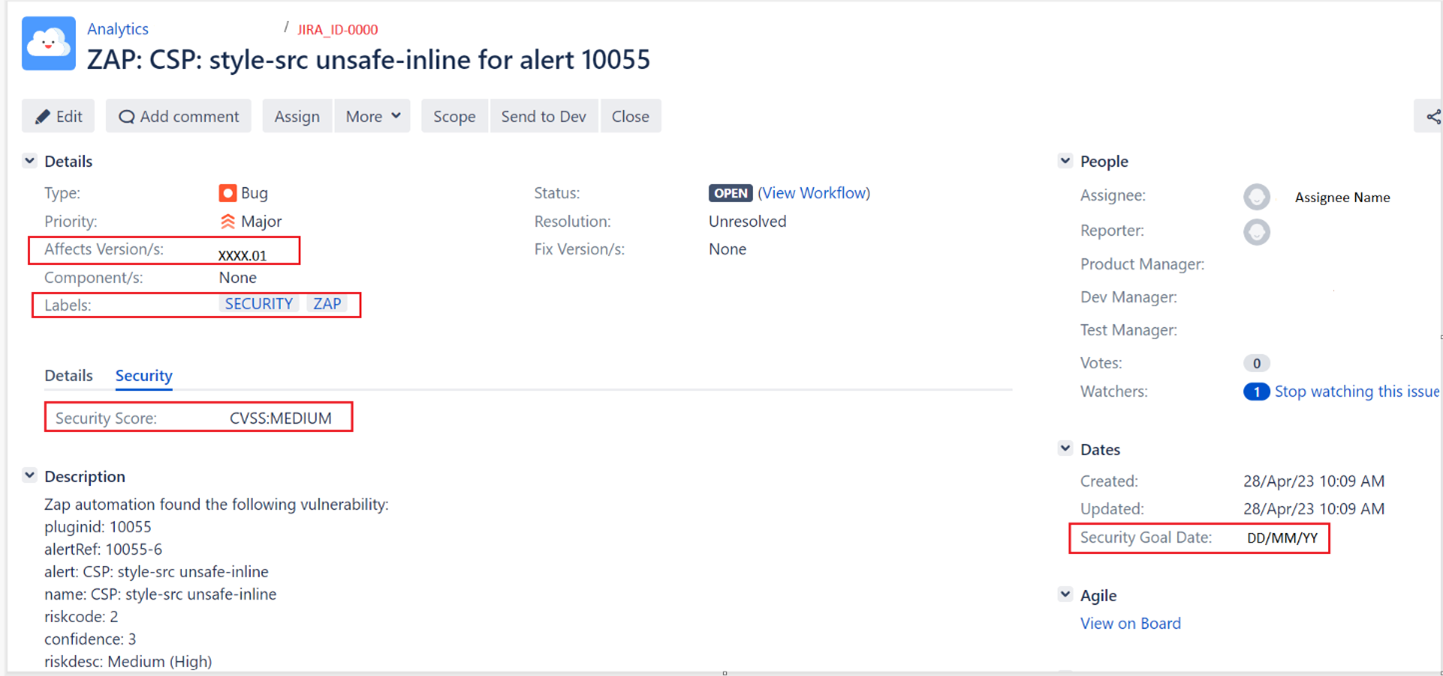
3. When the Python script reads in an alert filter, a file of known vulnerabilities can be flagged to be ignored. Next, the script processes any differences between the alert filter and the report. If a new vulnerability is found, a new Jira ticket is automatically generated and assigned to a team member to triage. This aligns with our standard security requirements. Subsequently, the filter is updated with the newly identified alert so it will be recognized in the next scan. At the end of the script, it sends all alert records to our CQM database. This tracking mechanism brings benefits to our practice. For example, it allows us to use Jira for cross-referencing, accountability, and minimizing manual intervention. An example of an automated Jira ticket generated when the automation detected a new security vulnerability is seen in Figure 2.
4. SAS Studio is used to develop code to query the security data from the CQM database to produce a SAS data set with the results.
5. The SAS code is integrated into the SAS Job Execution Service. This is a REST service that calls the SAS Job definition to run the SAS code and then loads the table into CAS (Cloud Analytic Services).
6. A SAS Visual Analytics report is designed to aggregate the security data collected from the security scans. This gives a visual analytical view of the security data of the products.
7. Finally, to tie everything together, a Jenkins pipeline is built that contains the following stages:
-
- Initiate ZAP and configure ZAP settings via API calls. Our process is more efficient by using the OOTB (Out of the box) ZAP container stable release version directly from the ZAP repository. This allows us to avoid manual ZAP software upgrades or maintenance.
- Run test container to execute test cases on a deployed server after the code has been pushed, merged, and passed the initial verification. This is what makes our process more shift-left. We also set ZAP to scan in both passive and active modes to get wider code coverage. At the end of this stage, the security scan is complete, and the report of the scans is available to use.
- Call the Python scripts that were mentioned in Step 2 and Step 3 to parse the security XML report and then send the records to CQM.
- Send email notifications of the scan results for any new alerts.
- Clean up the test container, ZAP container, and Jenkins workspace.
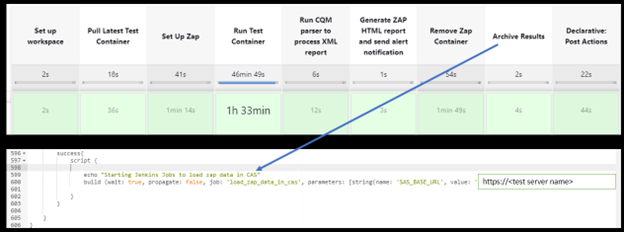
- At the end of the Jenkins pipeline script, it triggers another Jenkins job to run the SAS Job Execution as mentioned in Step 5. This step is to ensure that the SAS Visual Analytics report processes new data after each run. Figure 3 is an example of the current Jenkins pipeline script.
The reporting of security data
A well-known saying is “Knowledge is power,” and we believe having the right data will build that knowledge. This shift-left automated effort gives us the security data that we need to process, share, and analyze for a better understanding of our products. To put this in perspective, here are some ways the security data can help many of us in different situations:
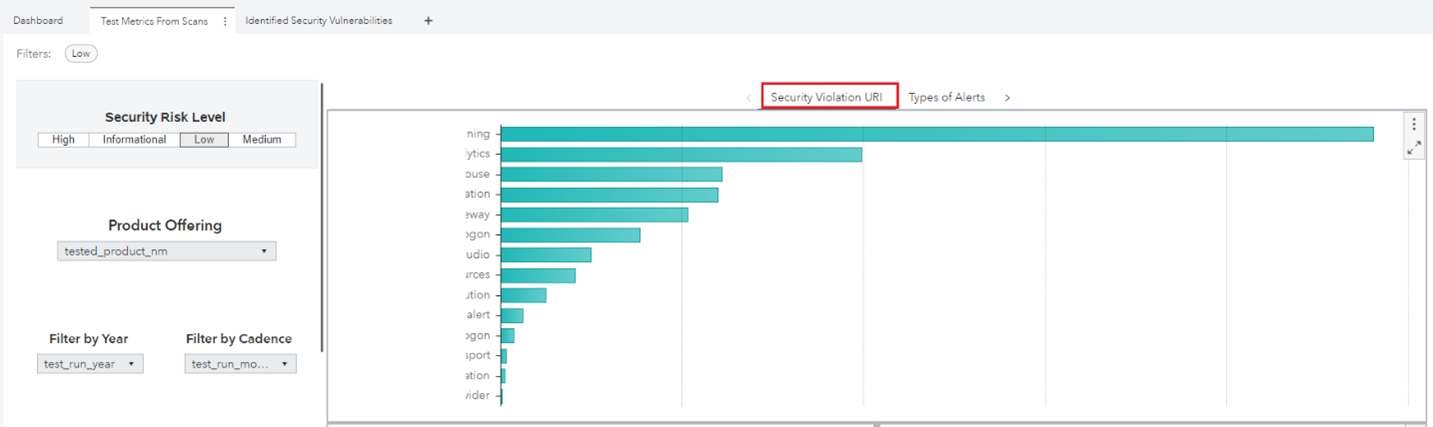
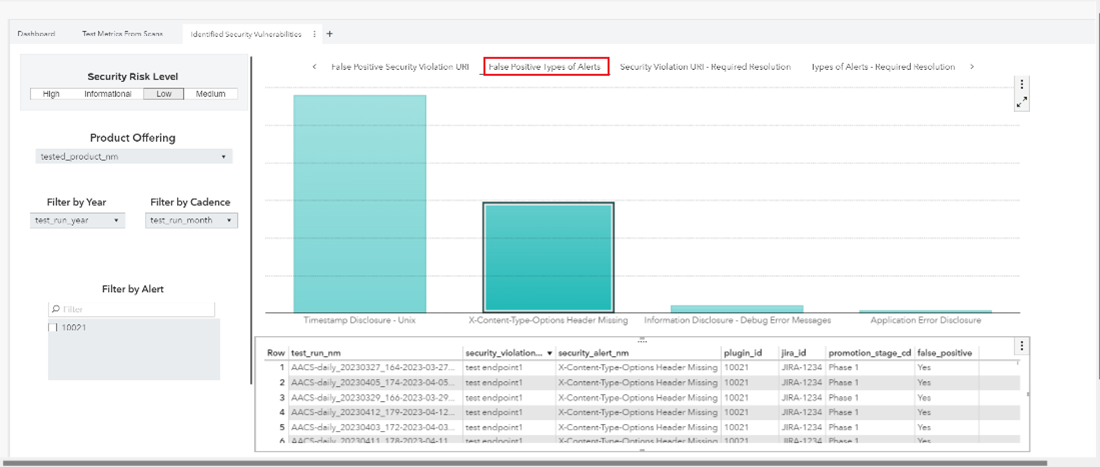
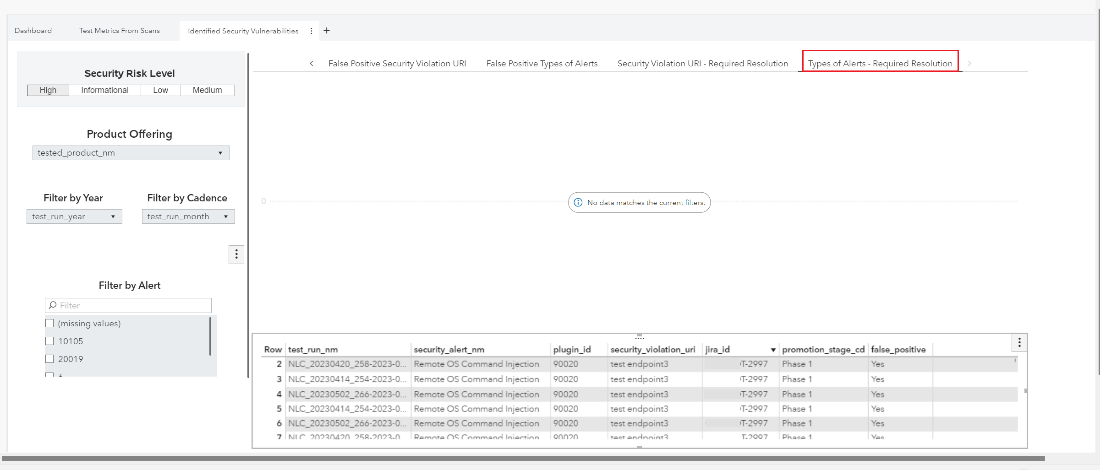
- Any interested parties can have access to the SAS Visual Analytics report. The retention and collection of these data are also valuable for auditing. The report contains the following:
- Elapsed time of when test containers were scanned.
- Types of alerts, deployable units, and their endpoints with security violations.
- Alerts were identified as false positives or required resolution.
- Data can be filtered by release year, cadence, severity, or deployable units.
- Security champions can search for historical records in past Jira tickets to assist with troubleshooting. Additionally, having a consistent formatting and layout in Jira at ticket creation across teams makes it easy to document issues related to security.
- Security experts and developers can also utilize these data points at security design reviews to improve our products.
- Data analysts can utilize these data to build models like forecasting a prediction on various products.
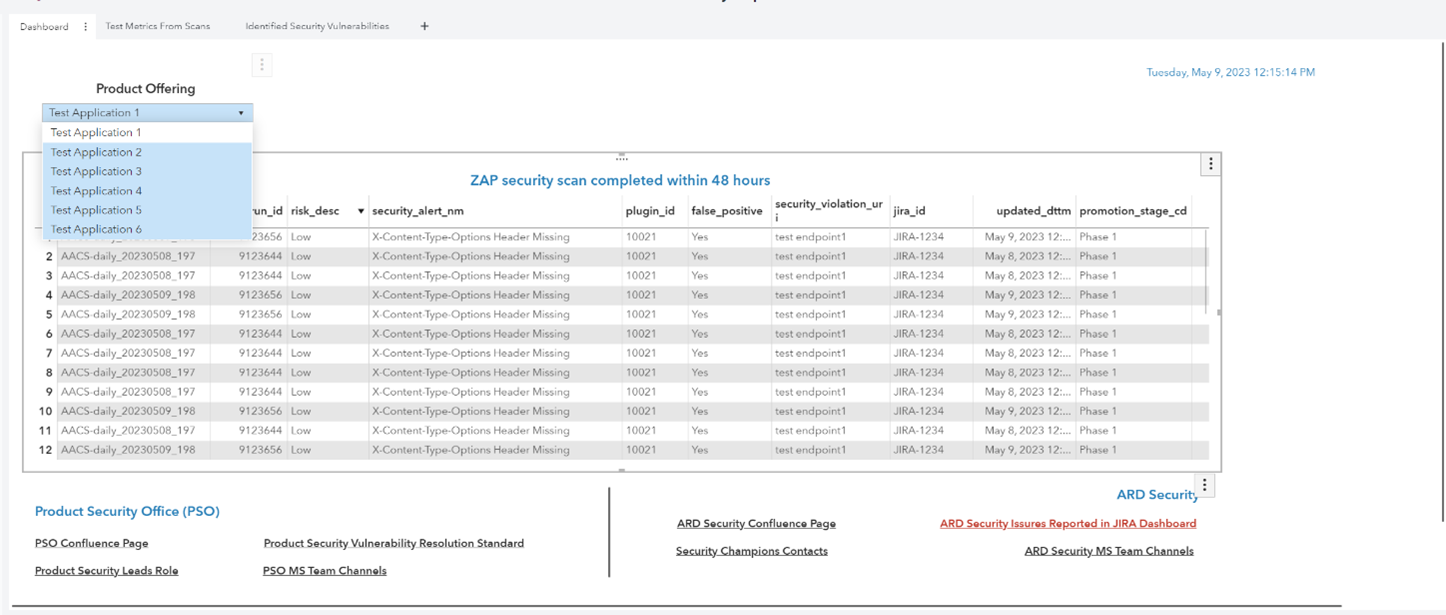
A picture is worth a thousand words. Below are some snapshots of our SAS Visual Analytics report. The data have been sanitized from our test scan results.
Our DevOps journey – A collection of lessons learned
Our shift-left automated effort to track and report security DAST vulnerability received positive feedback in many ways. It alleviates the manual responsibilities so security champions can focus on other work priorities. The Jenkins job was shared with other teams within our organization. The same process is repeated for both the Application Programming Interface (API) and User Interface (UI) test containers. We continue to collect security data from different applications and deployable units regularly. The SAS Visual Analytics report is current with security data findings and trends and holds keys to many more opportunities. This makes our DevOps journey more relevant than ever because of what we learned and how we improved. Here are a few lessons learned:
- Manage resources wisely to run security scans for both API and UI test containers. We had to schedule these scans apart, otherwise, the UI test containers would plunge the performance of both Jenkins and deployment servers.
- Fine-tune ZAP settings to exclude any endpoints that are irrelevant to a specific deployable unit because of dependencies or overlaps within our family of applications.
- Forces of nature like security policies - software algorithms for vulnerability detection can change or get updated over time. Whenever these changes emerge, it is best to flush out any previously identified false positives to avoid any potential misidentified issues in the later runs. As a rule of thumb, we strive to reset the alert filter whenever ZAP releases a major version.
That being said, the benefits outweighed the nuisances, and our DevOps journey continues. We would love to hear your feedback about your CI/CD experience!