
Walking in the park, it’s not unusual to see children practicing their favorite sports. They often spend hours and hours trying to sharpen their skills. On their own, it’s difficult to figure out what to work on and how to improve. It’s expensive to hire a coach who could teach them what to do to improve to the next level. So are there any alternatives?
Yes, there is! Introducing the SAS Batting Lab, developed to help young baseball players with their batting game. It’s built on the concept of a batting cage and uses built-in technology to help improve batting skills. At the same time, players also gain a better understanding of data and analytics. This makes the SAS Batting Lab a triple play with a focus on batting improvement, analytics, and data literacy! This post discusses the analytics used behind the scenes of this innovative technology.
The motivation and the action
During training, players might ask questions that sound simple but are not necessarily easy to answer. Experienced human coaches can answer these questions because they have a thorough understanding of the game based on thousands of hours of hard work and training. In this post, we discuss how a model behind the SAS Batting Lab can help gain insight into the swing phases that are difficult to identify with the human eye. As well, it can answer some of the questions that lead to improving the player's skill set. However, for a machine to serve as a coach, we need to first train it and allow it to understand what a good swing looks like.
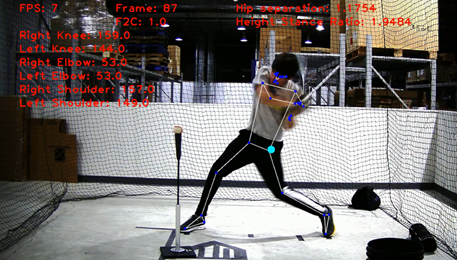
The training data include more than 500 swing videos from the North Carolina State University baseball and softball teams. The video tracks 19 joints on the player's body. Each joint is expressed as (x,y) coordinates to mark its position. Each video is approximately two seconds long and contains around 100 frames. Observations with x and y coordinates can be extracted from each frame for each joint. The data are indexed by time; therefore, creating a time series. The coordinates are normalized to achieve the same height for each player. Figure 1 shows how the joints are tracked in a video.
Model setup
In recent years, machine learning has become very popular and has made great advances. As an important member of this machine learning family, Hidden Markov models (HMMs) have been widely applied in speech recognition, facial expression recognition, gene prediction, and so on. HMMs have special advantages like interpretability and flexibility. This makes them especially suitable for some pattern recognition tasks that the Batting Lab requires.
Figure 2 shows how the HMM is used to find the hidden phases behind each observable frame.
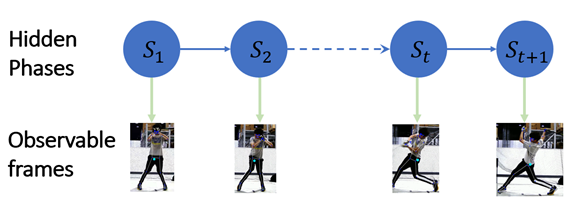
The HMM categorizes the player's moves by a series of groups and labels them with the swing phases. The swing phases are connected by the transition probabilities. In each phase, a set of parameters determines how the data are generated in this phase.
For example, in a Gaussian HMM, those parameters are the mean vectors and covariance matrices. Those frames are the observable data depending on the hidden phases St behind them. In each hidden phase, there is a move recommended by the model that was learned by observing many accurate player swings. Those phases are like how human coaches summarize baseball positions: stance, load, stride, attack, contact, and follow-through. The goal of the model training is to find the St to fit all videos.

The big problem is that HMM, with high dimensionality, has lots of local optima. So, the optimizer plays an important role here. Each observation extracted from the frame contains a pair of coordinates for every joint. Therefore, 19 joints generate 38 variables to mark the position of the player's swing. In the Gaussian HMM, there is a mean vector and covariance matrix in every hidden phase.
In this model setting, we have 38 parameters for the mean vector and 741 parameters for the covariance matrix in each hidden phase. That leads to estimating thousands of parameters because there should be dozens of hidden phases. In this case, instead of the classical optimizers (like Active Set or Interior Point algorithm) or machine learning optimization algorithms (like Stochastic Gradient Descent), the Expectation-Maximization (EM) algorithm is chosen. This is because it is specifically suitable for models with latent variables and high dimensionality.
Model selection
There are two challenges in the model training. The first is to decide how many hidden phases are in the model. The second is that the optimization result of the hidden Markov model with the EM algorithm depends heavily on the initial parameters. The solution is to search for the models with different combinations of the number of phases and the random seed. Then you need to compare their information criteria to pick the model. The Bayesian Information Criterion (BIC) is used to select the model because the minimal model setting is preferred. After dozens of hours of calculation on thousands of CPUs, the model with 46 hidden phases is the winner.
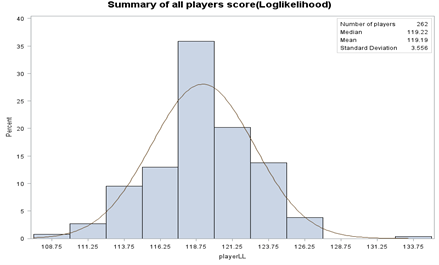
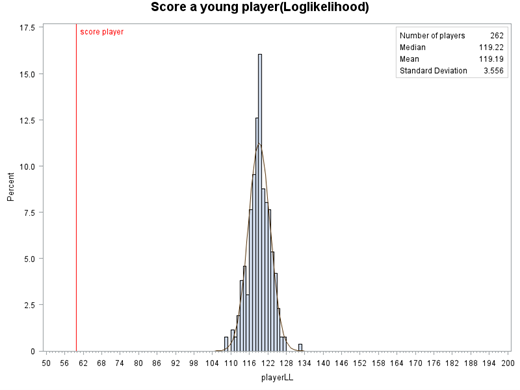
Figure 3 shows the histogram of the log likelihood of all the swings in the training data. The X axis is the log likelihood averaged by frame for a player, and the Y axis is the percentage.
The correct swings are on the right side of the plot. The incorrect ones are on the left side. The score or likelihood only represents how the player fits in the model or how the player's movement is similar to most players.
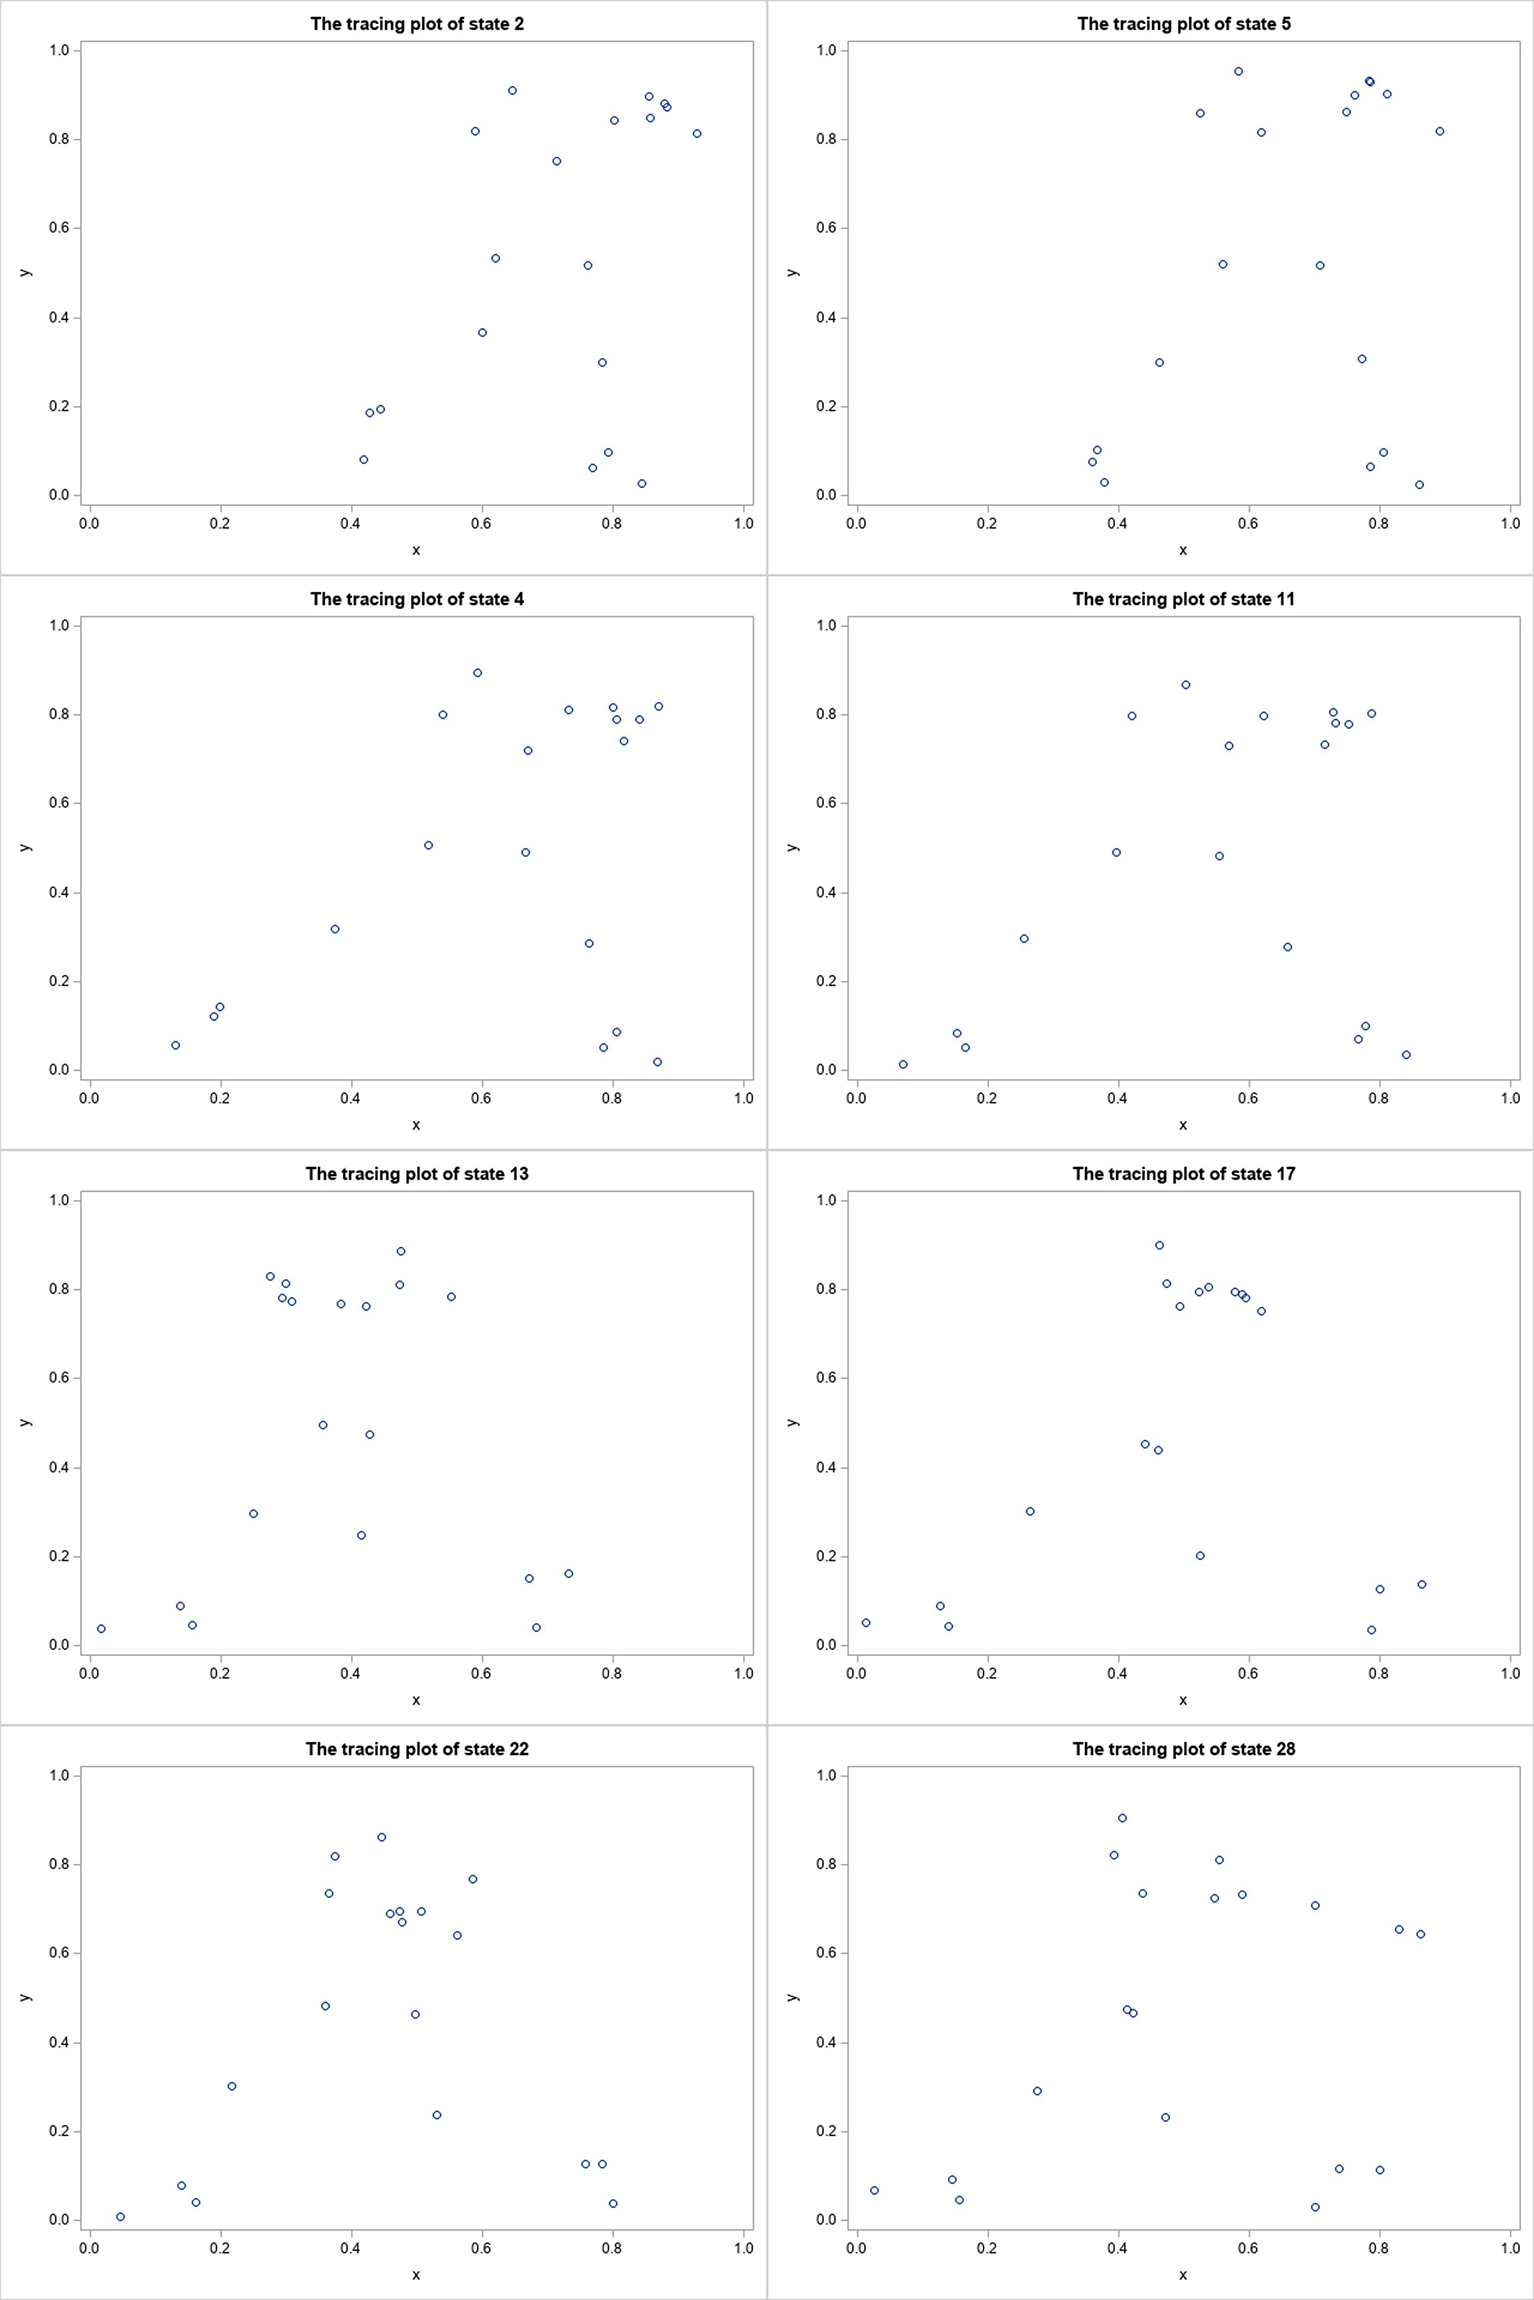
The HMM can find the hidden swing phases behind each video. We are interested in how the correct swings are associated with the hidden phases. Figure 4 shows the plots of the hidden phases of the optimal swing (the swing with the highest score).
Using the data from the player in Figure 4, for example, the model found eight phases to explain the optimal swing. There are eight phases associated with the frames of this one particular video. However, there are 46 phases summarizing all moves in hundreds of videos in the training data. All of the hundreds of thousands of frames can be explained with only 46 phases. That's the power of automated learning demonstrated by using the HMM procedure.
The scoring system
After training the model, the model specification with 46 hidden phases will be saved in the cloud connected to the SAS Batting Lab. The swing scoring system uses sensors and cameras in the batting cage to capture players' moves. Next, the data are streamed to the cloud. Finally, the model can score the player in real time and show the measurements and feedback on the screen of the SAS Batting Lab. So, the players can get information back immediately and work to improve their moves in the next round.
As an example, in Figure 5, a young player's score is located to the left of all the college players' scores. The mean log likelihood of the college players in the training data is 119. The young player's score is 60, implying that there is definite room for swing skill improvement.
To give concrete advice on improving the swing, we also need to score each frame and find the most deviate ones with the lowest scores. Figure 6 shows the young player's frame with the lowest score, compared to the swing phase HMM recommended (the right-side picture).
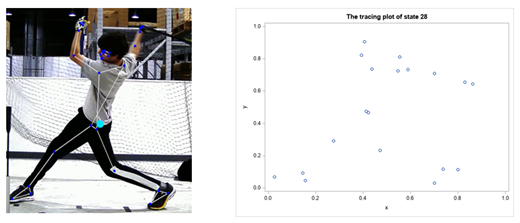
The deviate frame is compared to the swing phase of the trained model. The system then gives recommendations on how to improve the player's swing.
Summary
The whole training and scoring process shows us the potential of HMM to train players and solve real-world problems. The model successfully learned and summarized hundreds of thousands of frames into 46 swing phases that were used to obtain swing scores for beginner players in training. The HMM model was essential for building a successful SAS Batting Lab experience.
After the first six weeks of the program, all players had improved their skills, hitting the ball at a higher velocity. Some of them had a 50% improvement in the hitting speed. At the same time, these players learned about the power of data and analytics. This may in turn help foster an interest in analytics as a future career. The same technology has a great potential to be extended to other sports, like golf, cricket, or even yoga.
If you are interested in finding out more about HMM modeling, visit The HMM Procedure documentation. For more details about the SAS Batting Lab experience, read “Taking a swing at data literacy: an inside look at The SAS Batting Lab.”
