What’s the most important component of analytic analysis? The data? The model? The deployment? Getting the business problem right? All the above? Or does it simply depend on who you ask?
While the model gets all the attention, and the data requires most of the effort, there is that step between the business problem and the data, which INFORMS calls analytic problem framing, that often gets short shrift, but can pay big dividends when done right.
What is analytic problem framing?
Analytic problem framing involves translating the business problem into terms that can be addressed analytically via data and modeling. It’s at this stage that you work backwards from the results / outputs you want to the data/inputs you’re going to need, where you identify potential drivers and hypotheses to test, and where you nail down your assumptions. Analytic problem framing is the antithesis of merely working with the ready-to-hand data and seeing what comes of it, hoping for something insightful.
Typically, the process moves on from here to data collection, cleansing and transformation, methodology selection and model building, never to return. But if you’re willing to borrow and use a concept from complex adaptive systems – maps and models – you can make repeat use of this stage to improve your overall outcome.
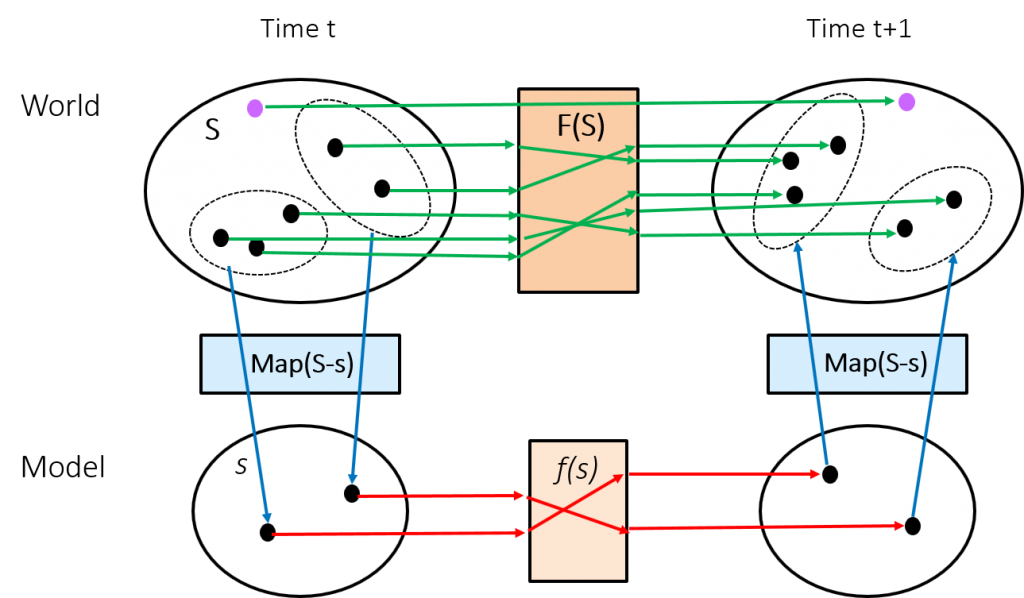
Consider the diagram below. The upper half represents the real world, the bottom half our models. Various states, S, of the real world are represented by dots in the upper portion. A transition function, F(S), changes a given state at time t to a different state at t+1. The function F(S) is unknown to the modeler, and likely too complex to ever be discovered (not to mention the dimensionality of S). A typical example might be the weather, where the laws of physics (F) change today’s sunny skies to rain tomorrow.
 But the modeler doesn’t fret about this too much. They have a number of tools in their bag to make the problem more tractable and produce a workable estimate, the two primary approaches being reduction of the state space and simplification of the transition function. What the diagram attempts to make clear is that these are two distinct components of the mapping and modeling paradigm.
The first step, the state space reduction, involves mapping the real world (S) to a practical subset (s). The second step, modeling, entails the search for a useful transition function (f). Model evaluation then involves the reverse mapping and comparison of the output of f(s) with the actual result of F(S) in the real world. You predicted sunny skies again, so what’s up with all the thunderstorms?
Adjust the model or adjust your view of the problem
When the evaluation comes up short of expectations the focus is often solely on the transition function f(s). Throw everything at the problem: regression, decision trees, neural networks, random forests, ensemble models, and see if the success metric can be improved (lower p-value, higher r-squared, lower MAPE, greater lift, etc …).
That’s all well and good, and usually does improve the outcome, but don’t forget about the mapping function and the decisions made at the analytic framework stage. Do we need to question and reconsider our assumptions? Do we need a different approach to variable/data selection/reduction? Is there a critical piece of missing data (e.g. the purple dot in the diagram) that we need to gather, or a causal driver that we’ve overlooked? Extending the mapping metaphor, have we included too much topographical information at the exclusion of transportation routes, or used a Mercator projection when we have been better served with a Mollweide, or a globe?
If you feel like you’re reaching the point of diminishing returns with model revision but still think there should be a better way, remember that you still have levers available back at the analytic framework and data stages. Often it’s simply impractical, for economic or other reasons, to revisit those earlier stages of the project, but don’t let such temporary constraints develop into habits. Maybe you can’t fight city hall this time, but you can lay the groundwork for a round two with more options at your disposal.


