As student growth or value-added measures become more prevalent in educator evaluation systems, many question how those ratings actually help teachers improve their practice. i.e. “How does a level 3 teacher become a level 4 or 5?” Robust and reliable value-added data serve as a great starting point for teachers to ask the right questions in pre- and post- observation conferences, in discussions with mentors, and in professional learning communities. Teachers will understand if they influenced more than the expected amount of growth for their students in different grade levels or subjects. This can illuminate strengths or “sweet spots” with different content. It can also point to areas for improvement with different curricula or subject matter.
However, I would argue that teachers need even more granular information to help them develop individual growth plans and seek professional development targeted to their specific needs. For this they need more than a value-added number on a piece of paper. Some states’ value-added systems provide the ability to dig deeper into diagnostic reports to learn about teacher performance with students at different achievement levels and with different characteristics. These diagnostic reports then illuminate “sweet spots” with different types of students.
| Want to hear more about teachers and administrators pairing value-added with diagnostic data for positive improvement purposes? Take a look at these videos featuring Ohio educators and administrators. |
It is possible that a teacher with an “Average” overall value-added rating is actually “Highly Effective” with low-achieving students, but “Ineffective” with high-achievers, or vice versa. Uncovering this information allows these teachers to learn the strategies they need to truly meet the needs of their students, whether low-, middle-, or high-achieving, English Language Learners, Special Education, or Gifted.
For example, below are three diagnostic reports for fictitious math teachers in Ohio. Based on demo data, all three teachers had an “Average” value-added rating of 3 on a 5-point scale. However, their diagnostic reports illustrate that they have very different professional development needs.
Example 1: A Teacher Diagnostic Report for an 8th grade math teacher
The diagnostic report in Example 1 illustrates a teacher who is highly effective with low and middle achievers, impacting greater gains than
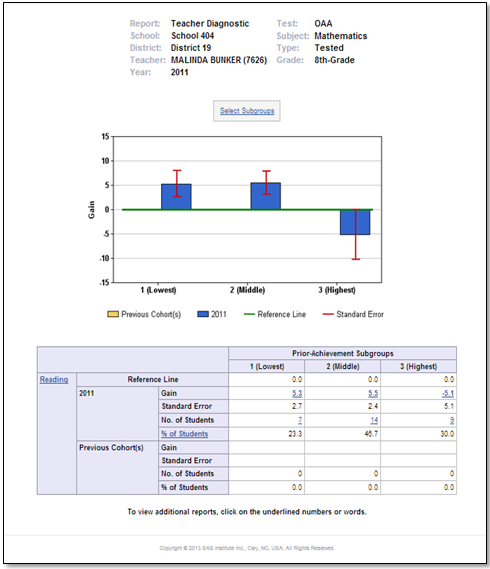
expected with students in these subgroups. However, this teacher struggled to challenge her high achievers and they most likely left the 8th grade at a lower achievement level than when they entered. If I were Ms. Bunker’s evaluator, I would pair this information with the qualitative data from my observation rubric to provide her with the targeted support she needs to better enrich and challenge her high achieving students. By focusing on these techniques and making sure high flyers do not fly under the radar next year, Ms. Bunker could improve upon her overall value-added rating.
Example 2: A Teacher Diagnostic Report for an 4th grade math teacher
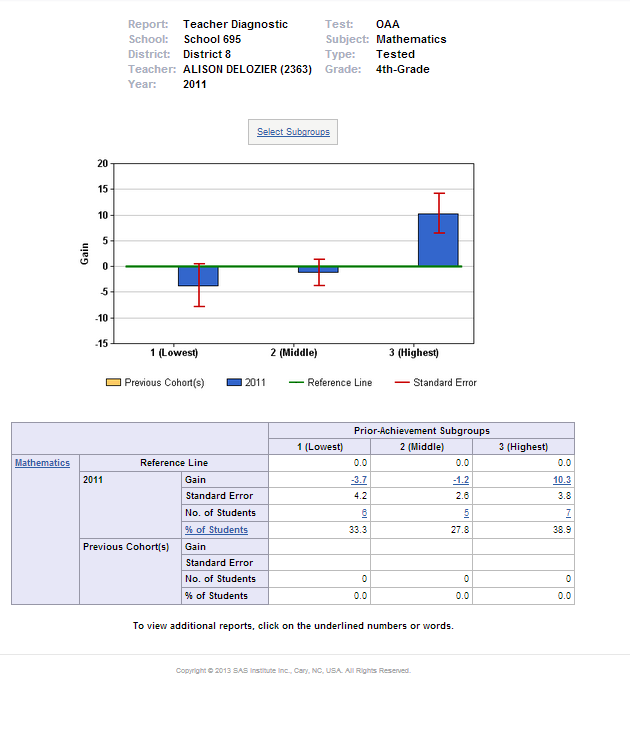
The diagnostic report in Example 2 illustrates opposite strengths and areas for improvement than in Example 1. Ms. Delozier is highly effective with her highest flyers, about average with her middle achievers, and most-likely struggling to reach her lowest performing students. What is most concerning with this type of diagnostic is that those low-achieving students need to be making the greatest gains in order to reduce the achievement gap. While Ms. Delozier can work on strategies to meet the needs of the low and middle subgroups, her principal could also utilize her strengths by enrolling more high achievers in her class(es). If her “sweet spot” lies with helping high flyers reach new heights, then it might be wise to schedule her with more of the students for which she is most effective. As a former high school teacher, I have seen too many high schools rely on seniority when assigning honors/AP courses to teachers. This type of diagnostic information allows effectiveness to be used in seniority’s place.
Example 3: A Teacher Diagnostic Report for an 7th grade math teacher
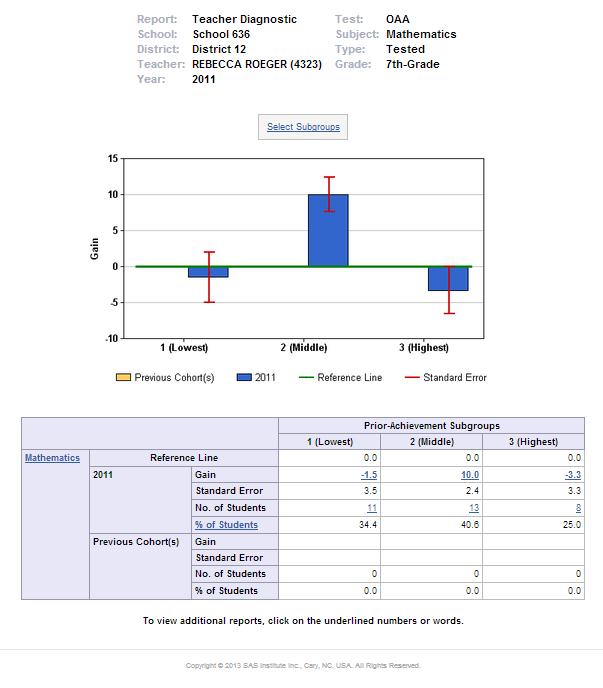
Example 3 provides a classic example of teaching to the middle. This type of diagnostic pattern is common for new teachers who lack the ability to adequately differentiate their instruction to meet the needs of all students in their classroom(s). Because Ms. Roeger was so effective with her 13 middle-achieving students, it balanced out the fact that she lost ground with her 11 lowest and 8 highest achievers. So while over half of her students likely lost some ground, she still received an “Average” value-added rating of a 3. Teachers and evaluators who look at patterns like this know they need some targeted support for differentiating instruction. However, once that skill improves, then Ms. Roeger’s overall value-added rating will likely soar.
I could not have made these inferences by looking at these teachers’ value-added ratings alone. They all taught math and all had very similar value-added estimates, with an “Average” performance level of a 3. Yet they all need different support in order to master their craft. The diagnostic reports behind the value-added ratings provide this additional insight and context. With that additional information, evaluators can truly tailor the professional development plans for all teachers and be more strategic about mentor pairings and student assignment. This will set more teachers up for success and leverage their strengths to help all students excel.