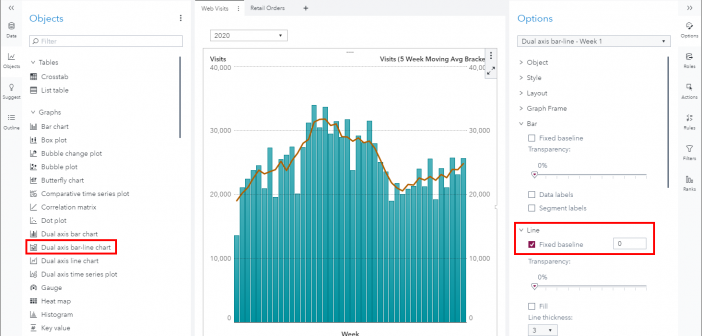
Data visualization has never been more widespread and consumed by a global audience as it has been this year with the Coronavirus pandemic. One visualization that is commonly used to display metrics of Coronavirus is a bar line chart where the bars display the actual values and the line is a moving average metric.
Tag: visualization
SAS Visual Analytics example: moving average
Using common filters in SAS Visual Analytics
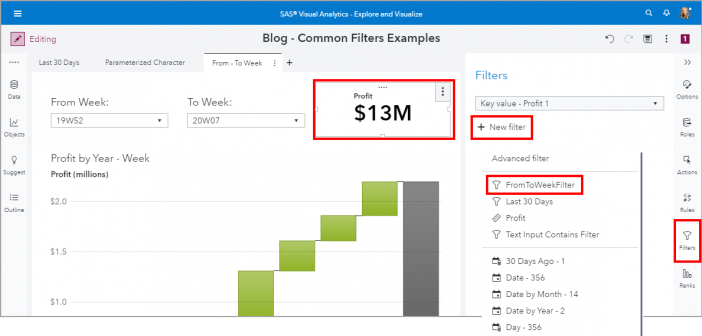
Common filters are filters that can be shared between objects in your reports. Common filter benefits include 1) Easy to assign the same filter conditions to other report objects, 2) When you edit a common filter, it is updated everywhere that the common filter is used, and 3) A common filter is available for the entire report, across pages.
New control prompt placement option in SAS Visual Analytics
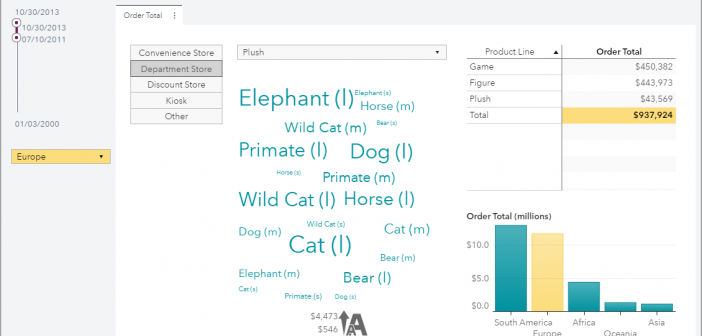
Introduced in the SAS Visual Analytics 8.4 release is the ability to control the layout position of these prompts. Using my example report, let’s change the placement of these prompts.