Mapping in SAS Viya gives the user plenty of options for maps to use. Signing in to ESRI on SAS Viya gives us many more. But what if the map that is needed is not available and is technically not a map at all? Well, not to worry, as there is a solution for that. Mapping on images is a lot like creating shapefiles on regular maps; the main difference is how that map is uploaded to SAS. This solution gives the user full control of what they would like to see in their reports and gives them full customizability for mapping visualizations.
The first step is having an ArcGIS Online account. This account needs to be set up with some credits to use as data storage currency so that the image the user uploads can be saved in the system storage. Once this step is complete, the user must also have a desktop version of ArcGIS Pro, where the maps can be built. Within the desktop application, the user must be connected to their ArcGIS Online account through the sign-in page to ensure everything is connected.
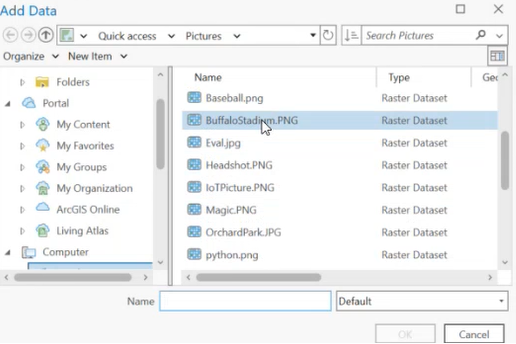
Now the user can begin the process. Once in ArcGIS Pro, a new project must be created. This will bring up a map of the world. In the contents pane, right-click Map and select Add Data. A box will pop up to browse the files, and the user can select the image they wish to use (Figure 1). For this example, the user will be using an image of a stadium.
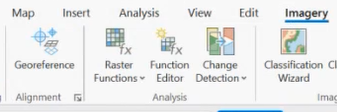
The image name will pop up below Map on the Contents pane, and a warning will say “Unknown Coordinate System”, which is fine since the user will be specifying their own coordinates for the image. To provide these coordinates, go to the Imagery tab at the top of the application, from there Imagery options should appear (Figure 2).
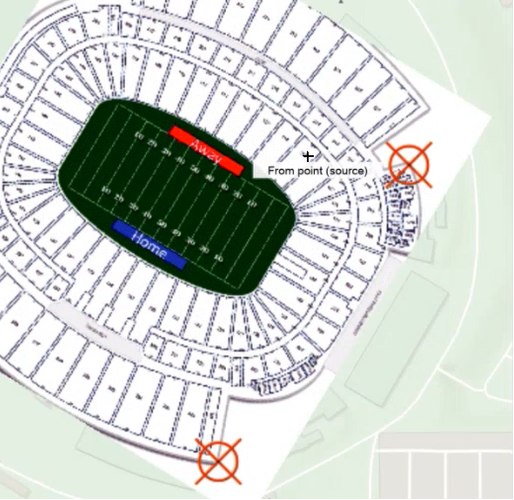
Right-click on the image name in the contents pane. Select “Zoom to Layer” and the user will be brought to where the picture is on the map (without a coordinate system, the image should originate in the middle of the Atlantic Ocean). In the Imagery tab, select the “Geo Reference” option. Then the system will allow the user to begin geo-referencing the image. The user must now choose where they would like the image to appear on a map. The user must select the “Add Control Points” option in the ribbon. Then the user can select a point on the picture. Here, a notable corner on the image is selected (Figure 3).
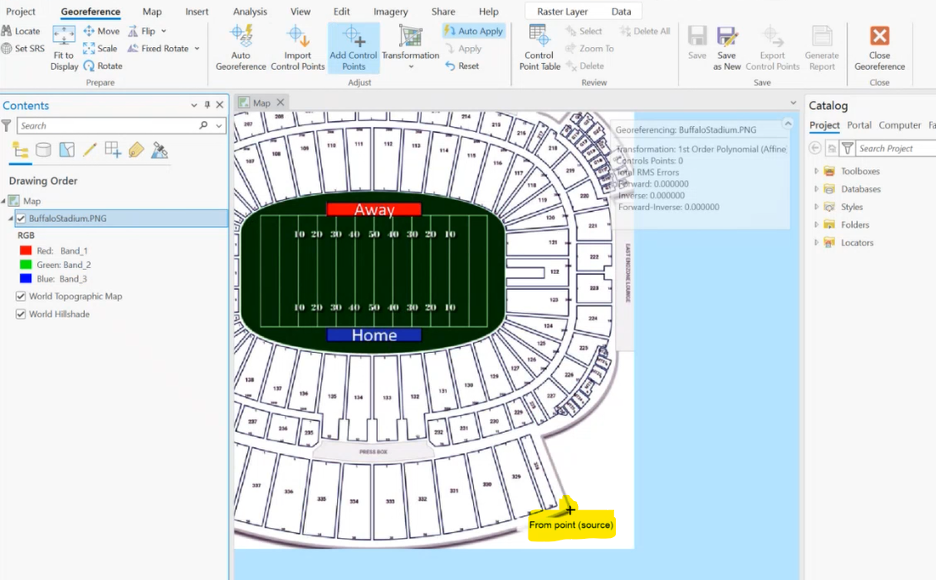
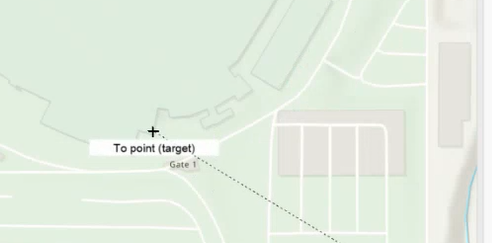
Once the initial point is selected, the user must then select a point on the map that this control point connects to (Figure 4).
The image will now be placed over the point in its original orientation (Figure 5).
The user must add another control point to get the image to follow the proper orientation of its place on a map. To add another control point, select the point on the image as a source point and then select another point on the map as a target point (Figure 6).
The image should follow its proper orientation now, but further reference points may be needed to be exact. In my experience, 3-4 is the maximum number of points needed, as the image will start to have distortion and become less accurate.
The image is now mapped and needs to be saved. Right-click on the Map in the Contents pane and select Properties. Give the Map a name, then close the Properties tab. The new name should be reflected where the word "Map" used to be. Right-click the new map name and select “Edit Metadata”. The user should now give the Item a Title, some tags (brief descriptions of the map), and a summary. Select “Apply” in the ribbon and close the metadata page. The user can now upload this image to their ArcGIS Online account. Go to the Share tab and select Web Layer – Publish Web Layer (Figure 7).
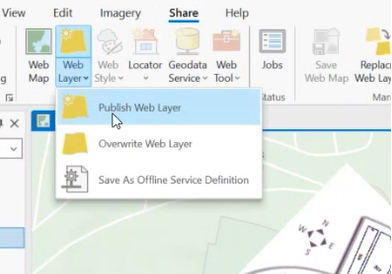
Figure 7: Publish Web Layer location
A share page will pop up. Select Layer Type to be Tile and Share with Everyone. Then select Publish. The image will now be uploaded to the ArcGIS Online account.
In ArcGIS Online, go to the My Content page. Find the name of the map that was just created, and the file should say “Tile Layer (hosted)”. Select the map, and an overview of the map will pop up. Go to Settings and scroll to Tile Layer (hosted). This is where the user chooses how detailed the image will be on the map's scale. In Figure 8, World to Country is the default, but depending on the size of the image, the user should change the dropdown from Country. For instance, if it is a map of a building, then go to the size of a small building; if it is a large park select the option that is closest to that size.
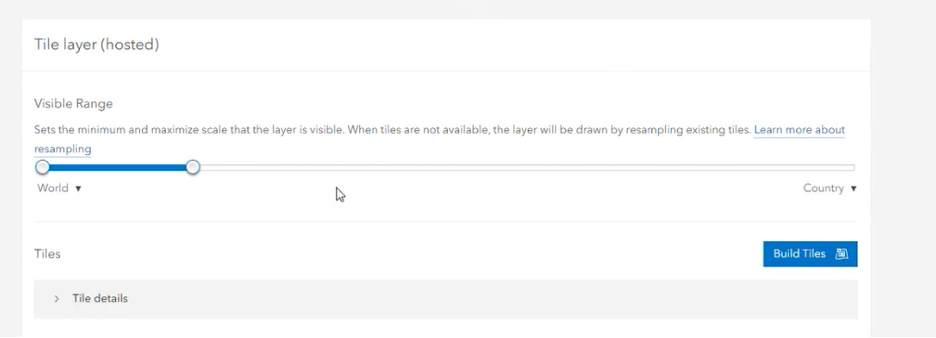 Figure 8: Selecting the Visible Range for the image, depending on the size of the image, the user can change how far out it can be seen from viewing the map
Next, do not select Build Tiles. First, select Save below the visible range selector (Figure 9).
 Figure 9: Saving the tile
Once saved, select Build Tiles. The tile screen will appear, and once it has finished uploading, select Create Tiles (Figure 10).
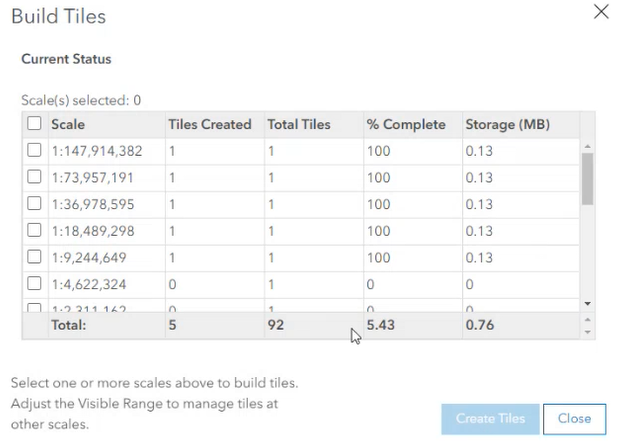
Figure 10: Creating the tiles
From there, our tile/image is uploaded to the ArcGIS cloud. To use this in SAS Viya, go into SAS Viya Explore and Visualize. The user must be signed into their ArcGIS Online account from there. If they are not, they can go to their user icon while in Explore and Visualize, select Settings, and select Geographic Mapping, and sign in there. Once signed in, bring a map into the Explore and Visualize workspace. This can be any of the maps in the Objects tab. In the options on the right-hand side, select Maps (Figure 11).
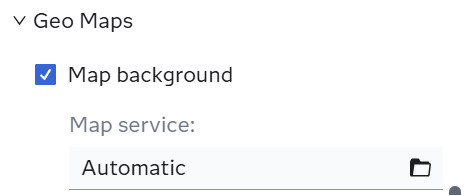
Figure 11: Choosing a map, it will default an Automatic map
The user’s maps will show up under User Tiles here. Select the file folder icon and a list of mapping options become available to the user (Figure 12). Since the user created a tile in ArcGIS Online, the image will be in that folder.
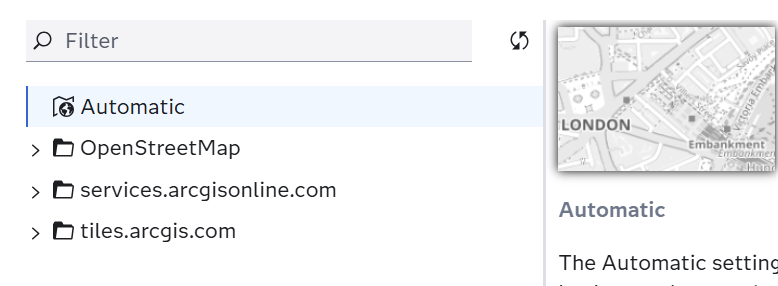
Figure 12: All mapping folders available. The ArcGIS.com folders only appear if the user is signed into their ArcGIS Online account in Viya
When the image is selected, it will populate within the map. Depending on the Visual Range selected in Figure 10, the user may need to zoom to the proper level to see the map. These maps can have shapefiles overlap the image as well. I have added shapefiles to each of the sections of the stadium, so the map is more interactive with data (Figure 13).

Figure 13: The final map result in Visual Analytics using a geo-region map
Another example of the image mapping is in Figure 14, with mapped body sections over a diagram of the human body.
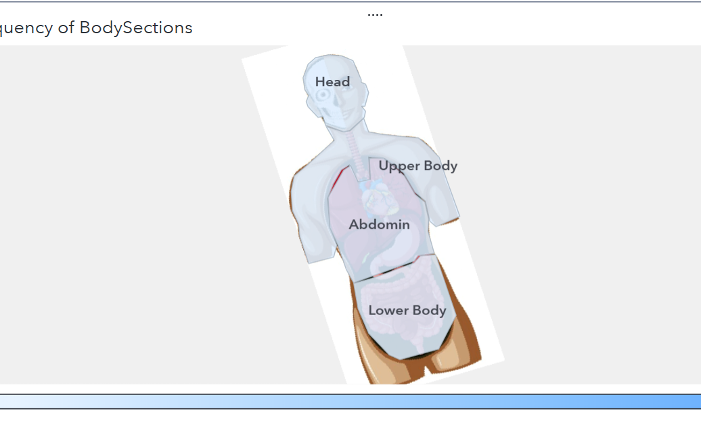 Figure 14: An image of the human body being mapped with custom shapefiles of body sections.
This is how the user can map over top of images. It allows them to customize their mapping interface for full freedom in their report visualizations.