What is an illicit financial flow?
An illicit financial flow is when the movement of money across borders is illegal in its source (e.g. corruption, smuggling, drug trafficking), its transfer (e.g. tax evasion) or its use (e.g. terrorist financing).
A movement is classified as an illicit flow when funds are illegally earned, transferred and/or utilized across an international border. Some examples of illicit financial flows might include:
- A drug cartel using trade-based money laundering techniques to mix legal money from the sale of used cars with illegal money from drug sales;
- An importer using trade dishonest invoicing to evade customs, duties, value-added/income taxes;
- A corrupt public official using a shell company to transfer dirty money to a bank account;
- A human trafficker carrying cash across the border and depositing it in a foreign bank;
- A member of a terrorist organization wiring money from one region to an operative in another.1
It is inherently difficult to measure given the illegality and opacity associated with some of these flows, their transfer across borders and the lack of transparency into the activities that constitute them. Many of these flows are generated by activities that are deemed financial crimes in the context of anti-money laundering and combating the financing of terrorism (AML/CFT).2
In this article, I will focus on the value of relational data and propose new applications of metrics that could be integrated in a more comprehensive AML platform, especially for detecting illicit financial flows and money laundering rings.
How can centrality metrics help?
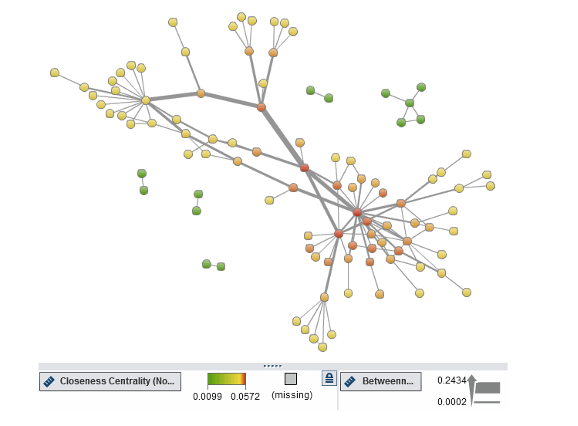
In a network of financial transactions, certain nodes (individuals or entities) might be more central or influential than others. Centrality metrics such as betweenness centrality, closeness centrality and degree centrality can help identify these key nodes. For example, traffickers might act as intermediaries between multiple sources and destinations of funds, resulting in high betweenness centrality.
Some common centrality metrics include:
Degree Centrality: This measures the number of connections a node has. Nodes with high degree centrality may represent key traffickers or locations where trafficking is prevalent.
Betweenness Centrality: This measures the extent to which a node lies on the shortest paths between other nodes in the network. Nodes with high betweenness centrality may act as intermediaries in trafficking routes.
Closeness Centrality: This measures how close a node is to all other nodes in the network. Nodes with high closeness centrality may be important hubs in the trafficking network.
Eigenvector Centrality: This measures the influence of a node in the network, taking into account the influence of its neighbors. Nodes with high eigenvector centrality may be influential traffickers or key locations.
One use case of centrality metrics is transaction monitoring investigation on a network level. In a classical transaction monitoring system, investigators use network graphs or metrics when investigating specific alert or an entity. If we had a broader graph for all the entities including transactional relationships, investigators can investigate entities regardless of whether it creates an alert or not by using centrality metrics as filters. In this case, hidden relationships and risks may be revealed. At this point, community detection becomes important.
Community detection, or clustering, is the process by which a network is partitioned into communities that will link within community sub-graphs which are more densely connected than the links between communities. Investigators can use this information to color the visualization by community to clearly differentiate between them. Furthermore, they can use the community information as a categorical filter, allowing them to narrow down focus to a single community at a time; a starting point for further exploration and analysis. With less data, they can add more detail like labels and arrow directions without the risk of overwhelming the ability to make sense of the visualization.3
Another use case of centrality metrics is creating predictive model-based scenarios. A predictive model is a mathematical or computational model that is designed to predict the outcome of a future event or situation based on historical data or existing patterns.
In this case, the risk classification of customers, geographical risk and transactional attributes can also be used along with these centrality metrics to create a predictive model for money laundering or illicit activity. This is especially useful for money laundering rings created by multiple individuals or entities working together to launder illicit funds.
The ID variable of the input dataset will be the customer ID and the target variable will be case-opened flags from previous months. Different models should be created for each customer segment for stronger accuracy.
The output of the model will give us the probability of customers who exist in money laundering rings so investigators can give extra attention to these customers.
Centrality metrics using SAS
This video provides expressions that calculate the four-centrality metrics in a simple network to hand-calculate metrics by using SAS Visual Analytics. The hand-calculated values are validated by viewing the metrics defined in the same network object.
SAS Visual Investigator also supports and directs analysts and investigators by showing entity closeness, betweenness and influence to highlight areas of potential interest. Seeing the complex network of relationships between people, places, things and events over time and across multiple dimensions helps analysts identify relationships that aren’t obvious.
To summarize, detecting illicit financial flows require much more than using traditional business methods. At this point, using centrality metrics in investigation and analytical models will provide wider detection approaches.
