 In this post, we expand on my previous post Automating Excel workbooks creation using SAS and demonstrate how to automatically / programmatically split a data table into separate worksheets ( with colored tabs ) of a single Microsoft Excel workbook.
While there are multiple ways of splitting data tables, for the purpose of this post we are going to split up a data table based on the value of one of its categorical variables (columns).
The approach described here is applicable to both SAS data tables and non-SAS data tables. In either case, you don’t even have to explicitly create interim data table subsets – each data table gets split directly into multiple Excel sheets.
In addition, there are no manual steps, the whole process is data-driven and is suitable for automatic execution either on its own schedule or as part of another automated process.
SAS macro solution for splitting a dataset into Excel worksheets
Let’s consider the following task. We have a data table SASHELP.FISH that has 159 observations and 7 variables. One of the variables, SPECIES, has a few unique values (such as ‘Perch’, ‘Whitefish, ‘Pike’, ‘Smelt’, etc.) We want to split this dataset by the unique SPECIES values so all the observations pertaining to each species are presented in separate worksheets of a single Excel workbook. These worksheets will be accessible by clicking on the corresponding tabs of the Excel workbook. We will also apply different colors to the tabs to enhance the user experience.
The following code demonstrates how this can be done using SAS macro with a macro loop.
/* Split data table into multiple sheets of an Excel workbook */ /* Create a list of and count unique SPECIES */ proc sql noprint; select distinct SPECIES, count(distinct SPECIES) into :sp_list separated by ' ', :nsp from SASHELP.FISH; quit; /* Create TABS color list */ %let color_list = #feb8b6 #c4feb6 #fefdb6 #feb6fa #b6d5fe #f0b6fe #fee6b6; /* Initiate ODS EXCEL destination */ filename target 'C:\Projects\SAS_to_Excel\Fish.xlsx'; ods excel file=target options (frozen_headers='on' embedded_titles='on'); /* Macro to loop through the list of unique TABS values */ %macro split_data_to_excel (intable=, tabvar=); %do i=1 %to &nsp; %let sp = %scan(&sp_list, &i, %str( )); %let tc = %scan(&color_list, &i, %str( )); ods excel options (sheet_name="&sp" tab_color="&tc"); title "&intable where &tabvar=&sp"; proc print data=&intable noobs; where &tabvar="&sp"; run; %end; %mend split_data_to_excel; %split_data_to_excel (intable=SASHELP.FISH, tabvar=SPECIES) ods excel close; |
Here are the code highlights:
- The first step, PROC SQL, creates two macro variables - sp_list containing a list of unique (distinct) values of variable SPECIES, and nsp containing the number (count) of the unique values for SPECIES.
- %let color_list assigns a list of colors (hexadecimal values) that we use to color-code our tabs.
- Then we specify the output Excel workbook file and open ODS EXCEL destination. Here we specify options (frozen_headers='on' embedded_titles='on') which are going to apply to all the tabs (sheets) in our Excel workbook.
- Then we define macro split_data_to_excel that accepts two parameters:
- intable – input table name;
- tabvar – tab variable whose unique values are used for subsetting the input data.
- Within this macro we have a macro loop with macro variable index i that iterates from 1 to &nsp (number of unique &tabvar values).
- Within the macro loop, we scan &sp_list and &color_list for &i-th word and use that word in the following statement:
ods excel options (sheet_name="&sp" tab_color="&tc");
With each iteration of the macro %DO-loop, this statement creates a new sheet, gives it a name and assigns a tab color. - The following TITLE and PROC PRINT will be generated for each %DO iteration and produce a subset of the input data table on the corresponding sheet.
- After the macro definition, we invoke this macro as
%split_data_to_excel (intable=SASHELP.FISH, tabvar=SPECIES)
and close ODS Excel.
Running this code will produce the following Excel workbook:
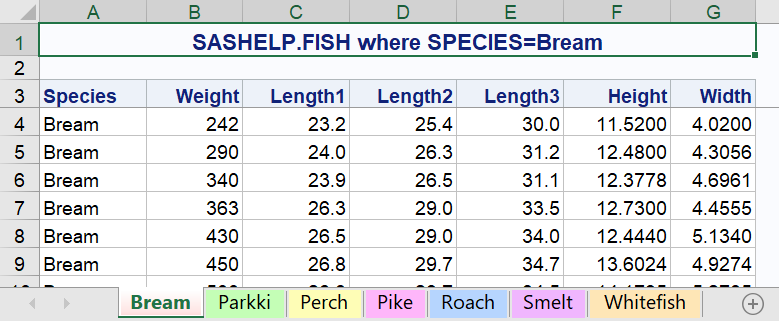
As you can see, each SPECIES is presented in its own worksheet (tab) and each tab is color-coded and properly labeled.
Data step solution for splitting a dataset into Excel worksheets
Besides the above macro solution, there is an alternative solution using a single SAS data step with CALL EXECUTE to dynamically generate SAS code and push it outside of the data step boundaries for execution. The following data step solution replaces the macro definition and macro invocation in the above macro solution:
data _null_; intable = 'SASHELP.FISH'; tabvar = 'SPECIES'; do i=1 to &nsp; sp = scan("&sp_list",i,' '); tc = scan("&color_list",i,' '); call execute('ods excel options (sheet_name="'||trim(sp)||'" tab_color="'||trim(tc)||'");'); call execute('title "'||intable||' where '||tabvar||'='||trim(sp)||'";'); call execute('proc print data='||intable||' noobs;'); call execute(' where '||tabvar||'="'||trim(sp)||'";'); call execute('run;'); end; run; |
For each unique SPECIES value, CALL EXECUTE will generate SAS code and push it outside of the data step in a queue where SAS compiles and executes it after the data step in the order it was generated. For each do-loop iteration, you will see the following corresponding snippets (marked with + sign) of the generated code in the SAS log:
NOTE: CALL EXECUTE generated line. 1 + ods excel options (sheet_name="Bream" tab_color="#feb8b6"); 2 + title "SASHELP.FISH where SPECIES=Bream"; 3 + proc print data=SASHELP.FISH noobs; 4 + where SPECIES="Bream"; 5 + run; NOTE: There were 35 observations read from the data set SASHELP.FISH. WHERE SPECIES='Bream'; |
The produced output will be identical to the above macro solution.
Questions
Which solution is more appealing to you? Do you have questions, comments, suggestions, ideas, other solutions, tips or tricks about splitting a data table into multiple Excel worksheets? Please share with us in the Comments section below.
Additional Resources
- ODS EXCEL Statement (SAS Output Delivery System: User’s Guide, 2022)
- Automating Excel workbooks creation using SAS (blog post by Leonid Batkhan, 2022)
- Using SAS® ODS EXCEL Destination "Print Features" to Format Your Excel Worksheets for Printing as You Create Them (PharmaSUG paper by William E Benjamin Jr., 2019)
- Tips for Using the ODS Excel Destination (blog post by Chevell Parker, 2017)

7 Comments
Thank you for the article! Just practiced and enjoyed the colors! 🙂
I can see the result in colors also in LibreOffice Calc, that is installed at the same desktop with SAS. And looks absolutely gorgeous when I open it in Excel 🙂
By the way, if you have any tips for getting friendlier with LibreOffice Calc - let me know please. From SAS window the data is exported there in some strange manner...
Thank you, Elena, for the feedback! I am glad you enjoyed the colors.
Unfortunately, I have never used Calc | LibreOffice, but as far as I know SAS does not support it (see these comments by Chris Hemedinger). For more up-to-date information on this issue, I suggest you contact SAS Technical Support at support@sas.com, where you can also relate your input on the need for such support.
Thank you, Leonid!!
Well! Unless you really need different tab colors, I would go for a shorter solution:
To find out about ods excel functionalities, feel free to ask more details about my online training program solutions. ods excel is part of a the reporting module of my main course (veronique.bourcier@xxformat.com).
Thank you, Véronique, for your addition. Indeed, one can use this technique for a shorter, but alas less colorful 🙂 solution. This approach is also presented in Jane Eslinger's blog post How to control the name of Excel sheets when they are all created at once.
I would also refer our readers to the documentation on #BYVALn | #BYVAL(variable-name) substitution that allows output customization based on BY variable value.
Thank you again, Leonid!
I am going to steal your useful macro to generate excel reports.
You are welcome, Tatiana! You are granted the "As Is - No Warranty" license to steal and use it 🙂