Unstructured text data is ubiquitous in both business and government and extracting value from it at scale is a common challenge. Organizations that have been around for a while often have vast paper archives. Digitizing these archives does not necessarily make them usable for search and analysis, since documents are commonly converted into images that are not inherently machine-readable. I recently participated in a project which aimed, as one of its goals, to automate the search and tagging of specific pages within such digitized archives. We encountered several challenges:

- These PDF-based files were very long, up to 3,000 pages and sometimes longer, so looking for relevant pages was like looking for a needle in a haystack.
- Files arrived in the tens of thousands per month and needed to be processed promptly to accommodate the customer’s business process.
- Relevant pages spanned decades, came in dozens of formats, were only partially machine-readable and exhibited various data quality problems related to how they had been handled prior to being digitized.
With some trial and error, our team developed a common-sense approach to classifying pages in these documents through a combination of advanced optical character recognition (OCR) technologies coupled with feature engineering using SAS Visual Text Analytics (VTA) and supervised machine learning using SAS Visual Data Mining and Machine Learning (VDMML).
In this two-part blog post, I describe our approach and share some lessons learned. I spend the most time on data preparation and feature engineering, because it was a crucial component of this work and is so critical for building accurate models. To maintain customer confidentiality, I am keeping the project details to a minimum and using generic data examples.
In this part of the post, I describe our high-level approach and dive into preprocessing and feature extraction. In Part II, I discuss data preparation for supervised modeling, model development and assessment. To replicate our approach, you would require licenses for SAS Visual Text Analytics and SAS Visual Data Mining and Machine Learning, and, if your data is not machine-readable, a high-quality OCR tool.
High-Level Approach
At a high level, the model development pipeline for this document classification problem looked like this:
- Preprocess and label data
- Extract features
- Build and evaluate a supervised model

Data preparation and preprocessing
When my colleagues and I got our first glimpse of the data, our knees nearly buckled. Although the data was in a PDF format, only a small portion of it was machine readable. Some other common issues included:
- Old, faded, stained, crumpled and torn pages
- Holes punched through crucial sections, such as form titles
- Salt-and-pepper effects and smudges from many rounds of faxing and photocopying
- Documents populated by hand, with a typewriter, or faintly printed on a matrix printer
- Handwritten notes and marks both on the margins and over the form body
We needed clean-ish text to work with, but it quickly became apparent we also needed a heavy-duty optical character recognition tool to extract it. After some trial and error, we chose to preprocess the data with the Microsoft Cognitive Services Read API. The API handles data in many formats and recognizes both typed and handwritten text. The API returns data in a JSON format which is easy to transform into delimited files or SAS tables. To give you a flavor of its ability to handle messy documents, consider this sample document in the image below.
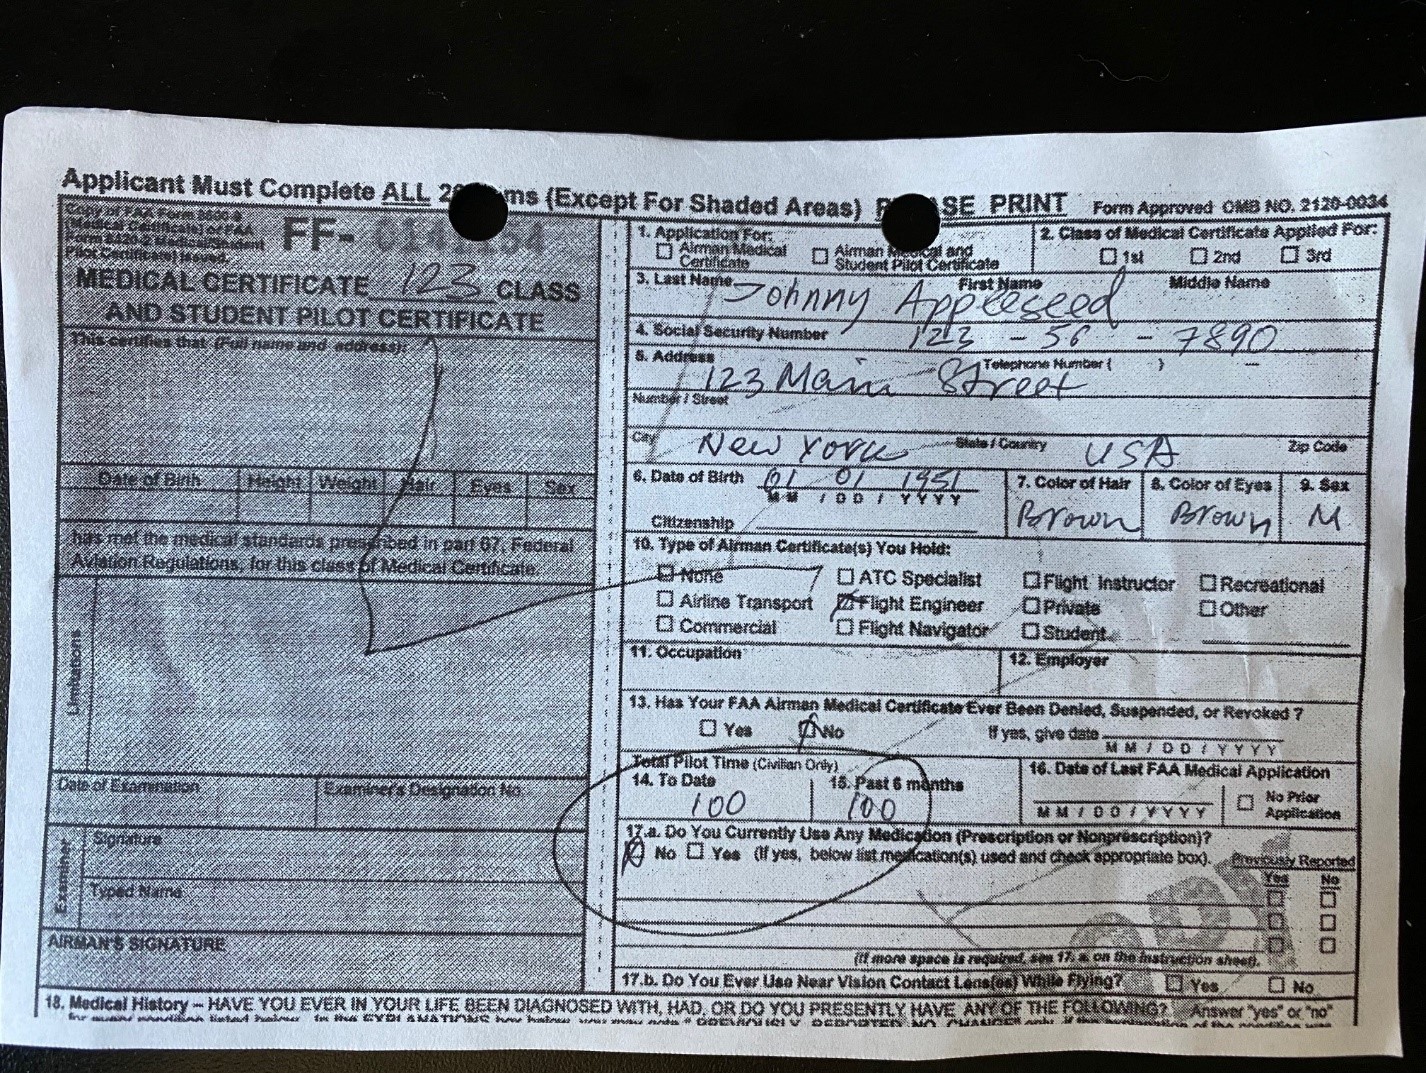
And now check out the text extracted by the API. I highlighted some areas of interest, including text that came from handwriting and the regions adjacent to the holes punched at the top. Considering the image quality, overall, the output is remarkably accurate: both hand-written and typed text is recognized, and the text is returned consistent with a left to right reading pattern.

We chose to parse the text data into one page per row, except for some special cases where it made more sense to break down continuous printouts into logical chunks.
 A parallel task was to label data for training a supervised model. We were tasked with finding and tagging several classes of forms and documents, with many different versions and styles within each document class. The vast majority of pages in these files were irrelevant, so we were dealing with rare targets. As often happens, the customer did not have reliably labeled data, so there were no shortcuts. We were forced to read through a sample of files and label pages manually. As tedious as it sounds, this gave our team an opportunity to become intimately familiar with the data and ask the customer numerous clarifying questions. I am confident getting to know the data before diving into modeling helped us understand and define the problem better, and ultimately enabled us to create a better product for the customer.
As we labeled the data, we took screenshots of unique versions of documents we encountered and populated a form catalog. This helped us create a visual cheat sheet for use in feature development. The catalog proved so useful that even the customer asked if they could have a copy of it to use for their internal trainings!
Feature engineering
The field of Natural Language Processing has exploded in recent years with significant advancements due to the introduction of novel deep learning architectures capable of solving many text-related problems. However, deep learning is not transparent, requires substantial computational resources and takes a lot of tuning to get the best results. Most importantly, it also requires significant amounts of labeled data, which is expensive to create. Therefore, our team chose to start with a simpler but more transparent approach.
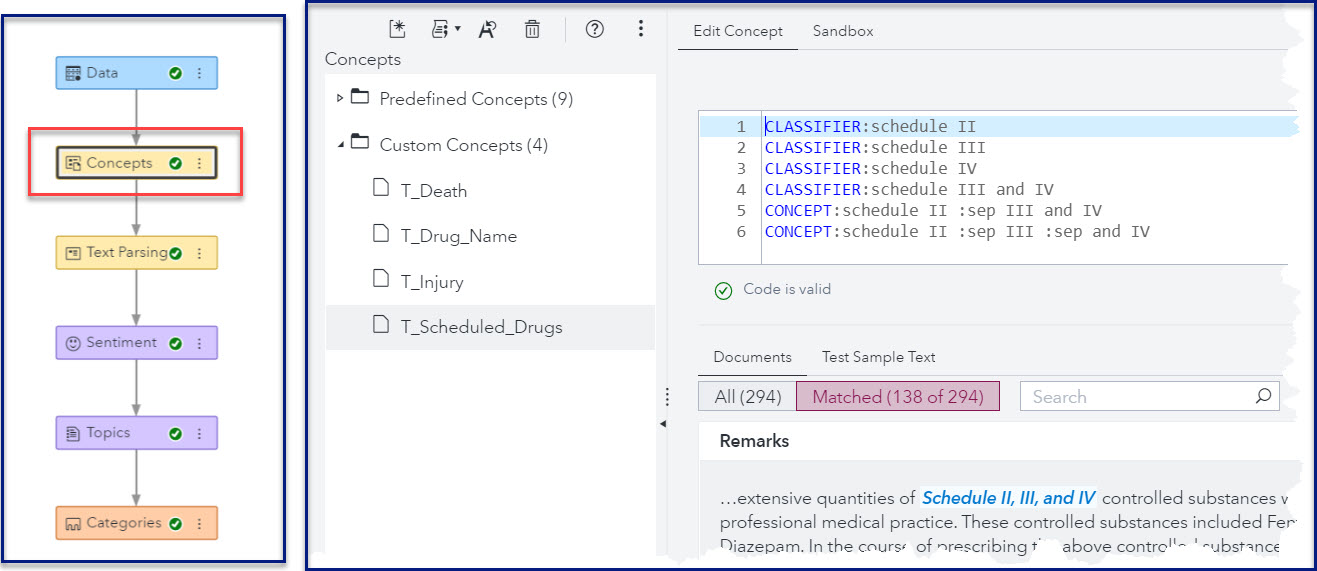
The cornerstone of this approach was to use SAS Visual Text Analytics (VTA), which runs in Cloud Analytics Services (CAS) inside the SAS Viya platform, to generate features for training a machine learning model. We used the Concepts node in VTA to create these features on a sample of records reserved for model training. The VTA Concepts node provides an interface for developing Language Interpretation Text Interpretation (LITI) rules to capture specific entities within a textual context. Because the LITI language is so flexible, you can write rules which overcome many data quality problems.
Consider again our sample document. In Figure 5, I highlighted some strings that are good candidates for extraction as features because they are part of the form structure and are easily readable with a naked eye, meaning that they should lend themselves well to OCR and remain relatively stable within each document class of interest.

The trick to extracting these strings as robust features using VTA is to anticipate some common ways in which the OCR tool may fail, as well as to account for changes in the wording of these common elements over time. This is where the power of the LITI rules comes in, and the work of building the form catalog pays off.
For example, consider a string “7. Color of Hair” as in the image to the right. In this example, it is perfectly readable and would make a good feature, but here are some of the pattern deviations you would want to account for when building rules to capture it: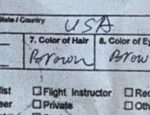
- OCR may incorrectly recognize the period as a comma or skip it altogether.
- OCR may incorrectly recognize the word “of” as something else, such as “ot”, “or”, etc. depending on the quality of the page.
- The digit 7 may change to 6, 7a, 8 or some other alphanumeric value depending on the version of the form.
- Different versions of the form may change the wording from Color of Hair to Hair Color.
Using the flexible LITI rules, you can easily account for all for these patterns. The table below shows some examples of LITI rules. The strings matched by each rule are shown in blue. Our objective is to match the “Color of Hair”/ “Hair Color” strings if they occur in close proximity to a corresponding digit, to ensure that we match the form feature rather than some other mention of an individual’s hair color. The rules in the table are gradually extended to provide more flexibility and match more sample strings.
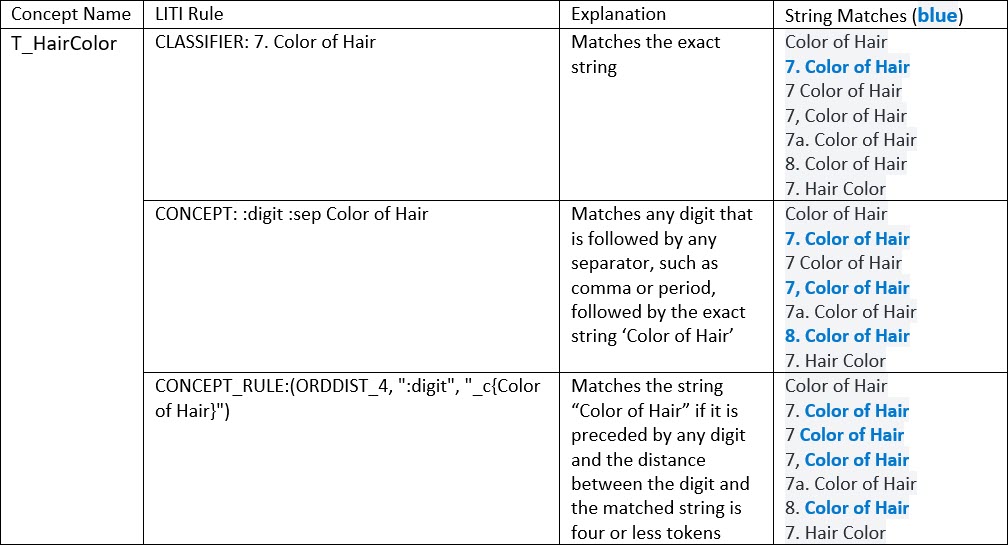
You can see how we are able to match more and more patterns as we introduce placeholders for digits, add separators and specify ordered distances between tokens to make the rules more flexible. In the last example, the matched strings do not include the item number, but that’s not a problem, because we know that “Color of Hair” will only be matched if it’s preceded by an item number. We don’t need to match the complete string to build a feature, as long as the matched string occurs in a relevant context.
We could continue to add rules like this to eventually match all desired string patterns. However, this could lead to increasingly complex and/or redundant rules. Instead, a preferred approach is to break down this task into pieces: match the digit, match the “Color of Hair” or “Hair Color” string, and then combine the results to get the final match. Table 2 shows the rules above refactored to follow this pattern. Instead of one concept, we now have three: one target concept, denoted with T_, and two supporting concepts, denoted with L_ (for lexicon or lookup).
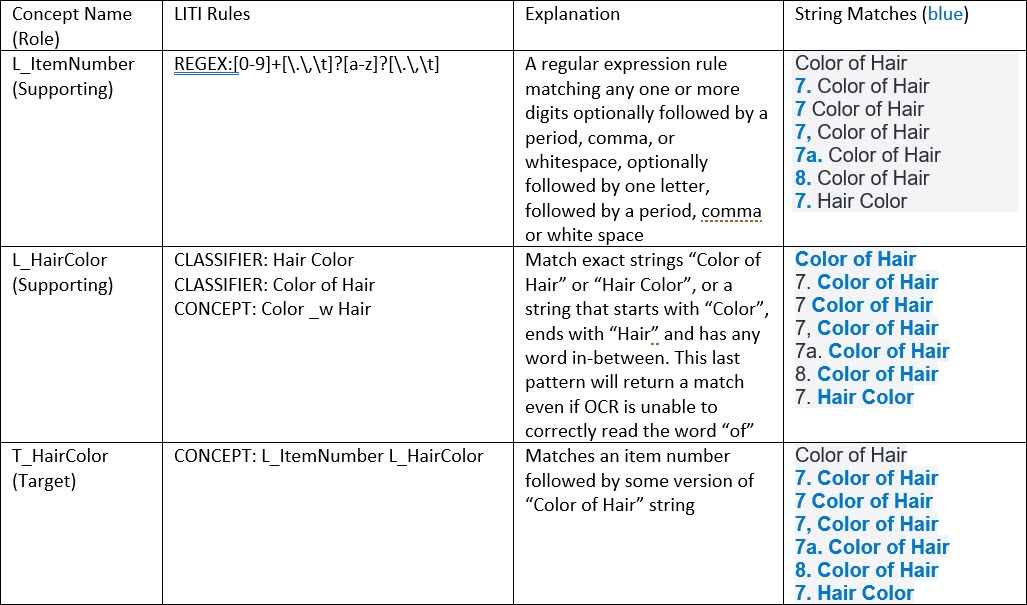
After refactoring the rules, the target concept T_HairColor catches every pattern we want to match and skips the one string that lacks an item number - as intended. What’s even better, we can now reuse some of this work to extract other document features. For example, the L_ItemNumber concept can be reused to match “6. Date of Birth”, “9. Sex”, “11. Occupation” and so on.
I didn’t cover every available rule type, but hopefully this gives you a taste of how they work. There are many great resources that can help you get started with the LITI rules, such as the SAS tutorial Creating Concept Rules Using Textual Elements in SAS Visual Text Analytics, but my favorite resource is SAS Text Analytics for Business Applications by SAS’ Teresa Jade et al. Keep in mind that LITI is proprietary to SAS and can be leveraged within SAS text analytics products, such as SAS Visual Text Analytics.
Conclusion
So far, I shared our approach to preprocessing messy documents and using SAS Visual Text Analytics concepts to extract features from documents of interest. If you are wondering about the next steps, check out Part II of this series, in which I discuss:
- Scoring VTA concepts and post-processing the output to prepare data for predictive modeling
- Building predictive models using the drag-and-drop interface of SAS Visual Data Mining and Machine Learning
- Assessing results
Acknowledgement
I would like to thank Dr. Greg Massey for reviewing this blog series.
