In SAS Studio, the ordering of rows and columns in the Table Analysis task are, by default, arranged by the internal ordering of the values used in the table. The table arranges the variables alphabetically or numerically by increasing value. For example, traditional coding uses 1 for Yes and 0 for No, so the No column is created as the first row because the internal value is 0. There are times when it makes more sense to change the order of the rows and/or columns.
Suppose you have data on risk factors for having a heart attack (including high blood pressure) and outcome data (heart attack). A data set called Risk has data on the status of blood pressure and heart attack (simulated data).
Here are the first 10 observations from that data set:
You can use PROC FREQ to create a 2x2 table or you can use the SAS Studio task called Table Analysis (in the Statistics task list) to create your table. Regardless of whether you decide to write a program or use a SAS Studio task, the resulting table looks like this: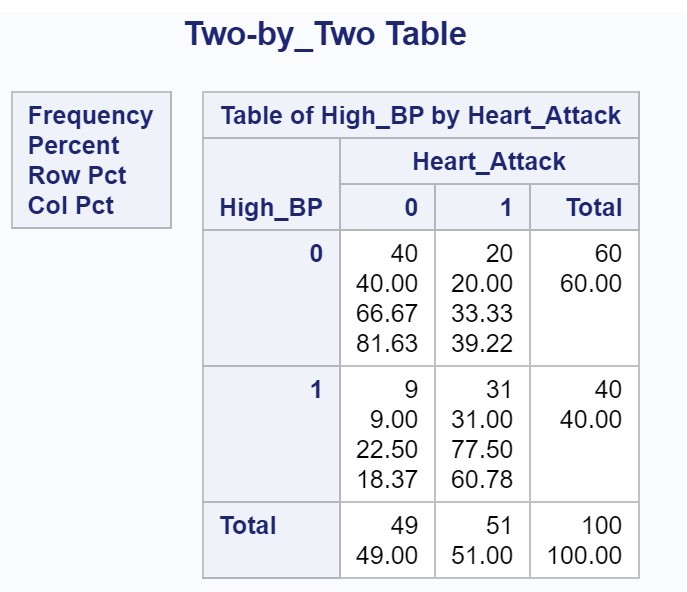
Because we are more interested in what causes heart attacks, we would prefer to have Yes (1) as the first row and column of the table. Here is how to do it with a short SAS program:
You create a format that labels 1 as '1:Yes' and 0 as '2:No' and associate this format with both variables in the PROC FREQ step. You also include the PROC FREQ option ORDER=formatted. This option orders values by their formatted values rather than the default ordering—by the internal values. The original table placed 0 before 1 for that reason. By being tricky and placing the 1: and 2: in the format label, you are forcing the Yes values to come before the No values (otherwise, 'No' would come before 'Yes' – alphabetical order). Here is the output:
If you decided to use a SAS Studio task to create the table, you would open the Code window and click the Edit icon. You could then add PROC FORMAT and the ORDER=formatted option in the TABLES statement.
For the curious readers who would like to see how the Risk data set was created, here is the code: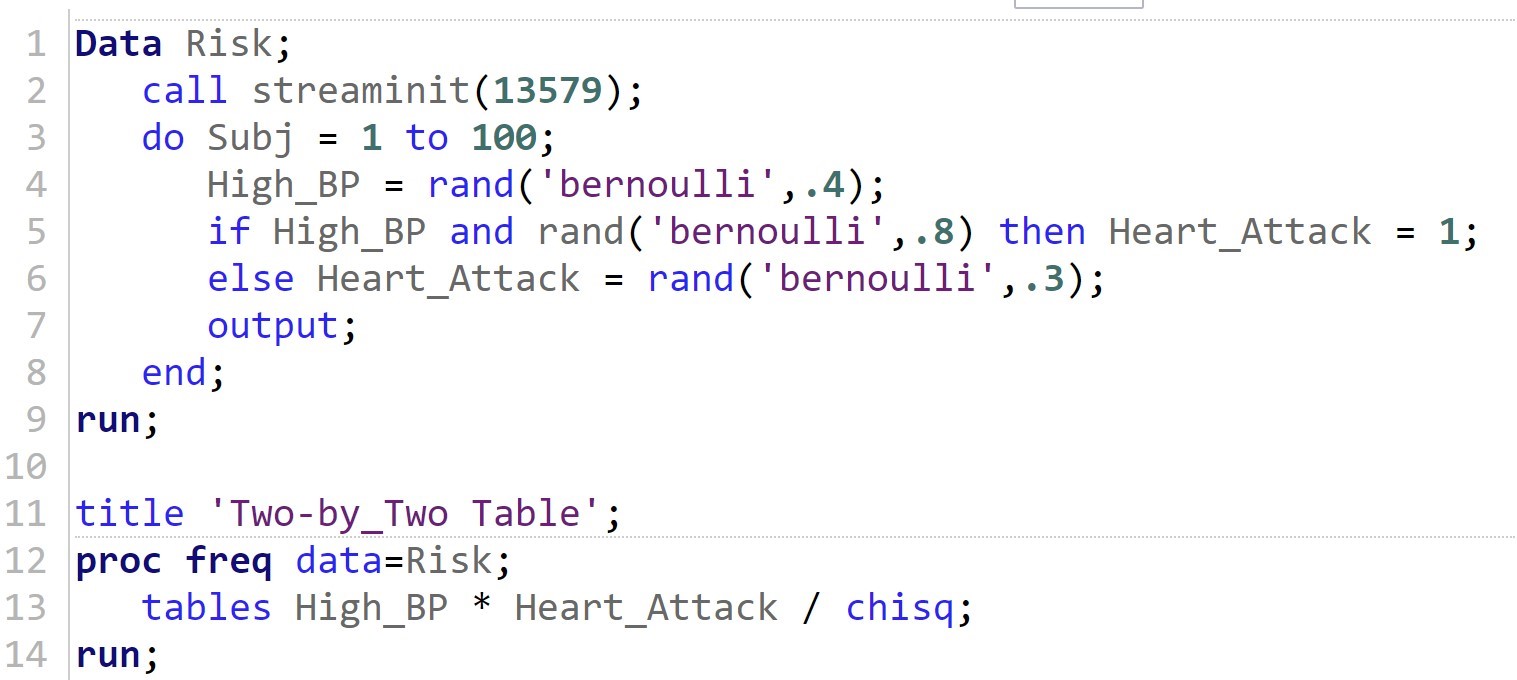
Here the RAND function is generating a Bernoulli distribution (0 or 1), based on a probability of a getting a 1. You specify this probability using the second argument of the function. One more note: The statement CALL STREAMINIT is used to generate the same series of random numbers every time you run the program. If you omit this statement, the program generates a different series of random numbers every time you run it.
You can read more about how to reorder rows and columns in a 2x2 table in my new book, A Gentle Introduction to Statistics Using SAS Studio in the Cloud. In that book, I demonstrate how to edit the SAS Studio-generated code to reorder rows and columns in a table.