In a previous post, I discussed using logs to troubleshoot problems in your Viya environment. In this post, I will look at some additional ways to troubleshoot using some of the tools provided by the Viya Operations Infrastructure. With applications, servers and numerous micro-services all working together and generating their own logs in Viya, it can be difficult to find relevant logs. In order to manage the large number of logs and to enable you to locate messages of interest, the operations infrastructure provides components to collect and store log messages.
The collection process is illustrated in the diagram below.
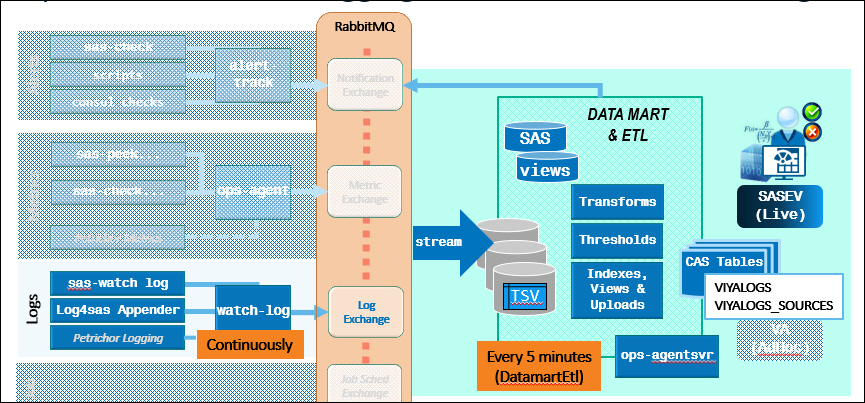
Co-ordinated by the operations infrastructure:
- sas-watch log continuously collects and sends log messages to the RabbitMQ exchange
- sas-stream pulls the messages from RabbitMQ and writes them to disk as a tab-separated value (TSV) file
- Every five minutes, the sas-ops-agentsrv runs the DatamartEtl task to extract log messages from the TSV file and load them into the VIYALOGS CAS-indexed search table
SAS Environment Manager uses the information in the VIYALOGS table and the VIYALOGS_SOURCES tables to display log messages and graphs that contain the frequency and trends of messages. The SAS Environment Manager LOG’s interface makes it really easy to search and analyze log messages. Using the interface, you can view, subset and search logs. The interface has the filtering capabilities on the left hand side and displays the messages on the right. By default, the filter is set to display all messages from all applications and services from the last 30 minutes.
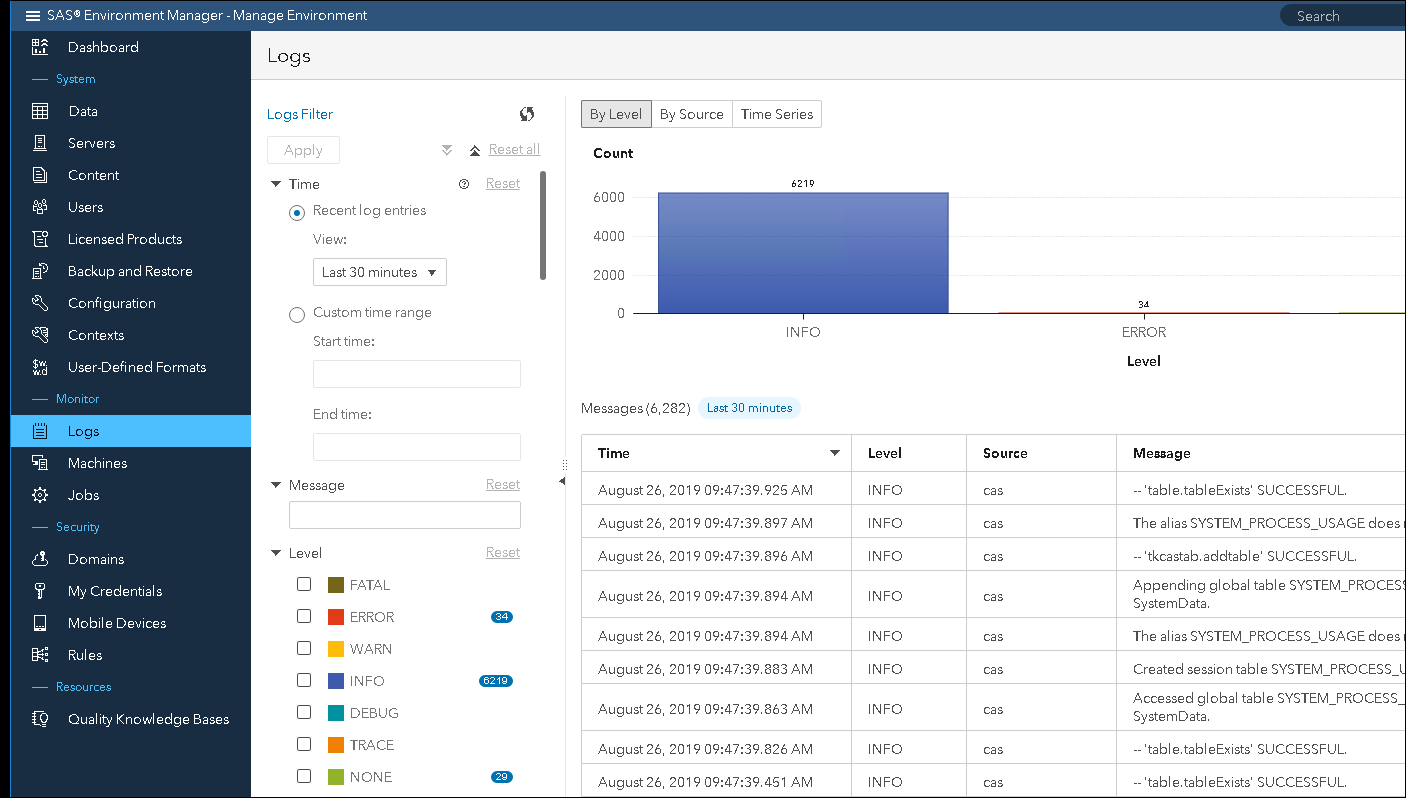
You can modify the filter to extend or shorten the timeframe, subset the level of messages displayed or the source (service/application) that the messages are coming from. You can also search for any text within a message.
Many administrators would prefer a command-line interface, and the good news is there is one.
sas-ops is a command-line interface which allows for the monitoring of the operational infrastructure in a SAS Viya deployment environment.
I have found the sas-ops log command very useful to troubleshoot problems. The sas-ops log command can be used to stream log messages that are generated by SAS Viya applications and services. The messages can be streamed to a terminal window or piped to a file. The sas-ops logs command is located at /opt/sas/viya/home/bin and can be run from any machine in a Viya environment that is included in the CommandLine.
When would you use sas-ops logs to stream log messages? Some potential scenarios are to:
- troubleshoot a poorly performing report or analysis
- debug problems in the environment such as logon issues
- monitor access to resources
In these cases, using sas-ops logs you can stream the log messages from all services to a single file or terminal.
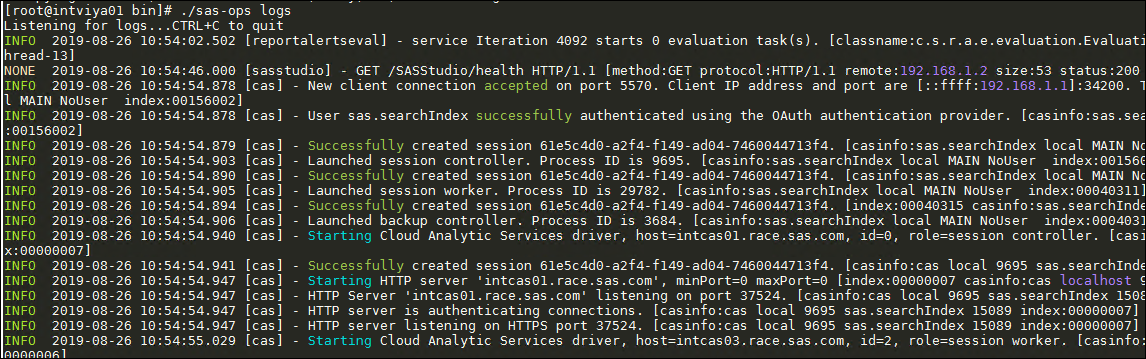
In its simplest form, the command live streams all log messages from a Viya environment to the terminal. Selecting CTRC+C will stop the streaming.
./sas-ops logs |
Partial output from the stream is shown below.
If you want to save the output, you can redirect the stream to a file.
./sas-ops logs > /tmp/mylog.log |
You can get more creative and achieve more complex tasks. You can change the format of the message output using –format. For example, to create a file with json which could be read by another process use:
./sas-ops logs –format pretty > mylogs.json |
You can also:
- stream messages for just a specific Viya service
- filter logs messages by text in a regular expression
- stream for a specific duration
The duration is specified using the format 0h0m0s0ms, but you can also use individual parts of the specification, for example 30s for 30 seconds or 5m for 5 minutes.
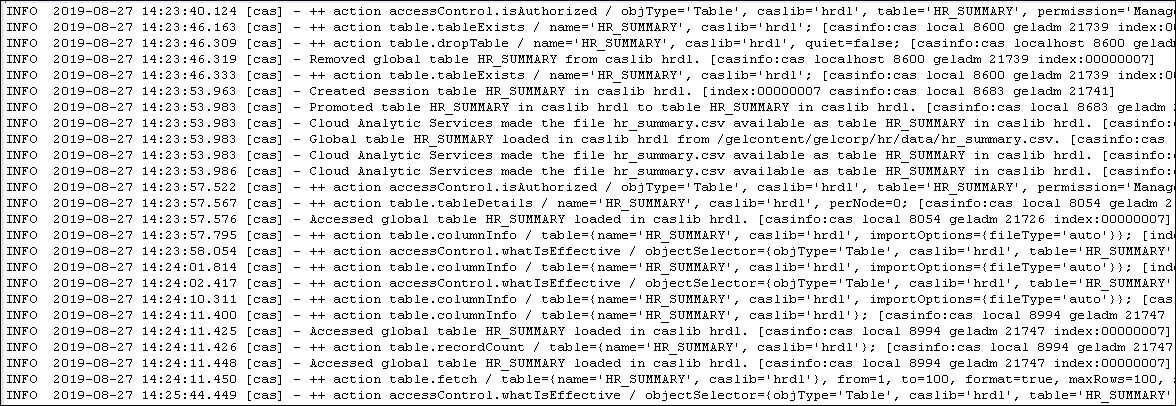
Consider the situation where we want to monitor access to a particular CAS table over a specific period of time. The command below will output to a file all messages that contain the table name HR_SUMMARY for a period of 5 minutes.
./sas-ops logs –match HR_SUMMARY –timeout 5m > /tmp/hr_summary_access.log |
The output shows all the CAS actions that were performed on the table during the time period.
You can subset the stream to one service.
Consider a case where a user is having an issue logging in and you suspect you have an issue with the LDAP setup. To check the problem, you can firstly enable DEBUG logging on com.sas.identities. Then stream the log messages from the identities service.
./sas-ops logs –format pretty –source identities > logonerrors.json |
Viewing the output shows that there is something wrong with the LDAP query.

I think you will agree that sas-ops logs is a very useful tool for monitoring and troubleshooting issues in a Viya environment. For more information, check out the following resources:
I would like to thank Bryan Ellington for his helpful input with this post.

6 Comments
Hi Gerry,
Is it possible to read the logs directly off the rabbitMQ queue and to push them to some other 3rd party product for log storing/analysis (i.e., Kibana)?
Thanks!
Hi Eyal,
In theory, this is possible. The two sides should have well-documented input and output formats. You might have to do some transformation of output to input.
Gerry
thanks for this guide, it was really interesting. Is there any way to change the loglevel that sas-watch picks up to WARN but keep the log level of the services to INFO?
You are welcome James.
You can use the --min-level option which sets the minimum level of log messages to display from the command.
./sas-ops logs --min-level WARN
Very informative post! Quick question, As mentioned in this post, sas-ops gives us the option to generate logs in JSON format, what other formats are supported? Is there a list which we can refer to?
A lot of our clients use central monitoring tool and they always ask how SAS Platform facilitates integration of third party monitoring tools to which our standard response is that the logs are stored on the file system as text files which can be consumed. Knowing what file formats can be generated using sas-ops would give us more flexibility in our response. Thanks!
Thanks, The various formats are documented in the admin guide.
https://go.documentation.sas.com/?cdcId=calcdc&cdcVersion=3.5&docsetId=calopsinf&docsetTarget=n01k7jf9i6qtpvn1a6o9rppi52j8.htm&locale=en
You can also get a list using -h with the sas-ops command.
/opt/sas/viya/home/bin/sas-ops logs -h
OPTIONS:
--format format Output format of log messages (json|pretty|line|file|term|plain|logfmt|template|event) (default "term")