 This post was also written by SAS' Xiangxiang Meng.
You can communicate with various clients (SAS, Python, Lua, Java, and REST) in the same place using SAS® Cloud Base Analytics Services (CAS) in SAS Viya.
The SAS Scripting Wrapper for Analytics Transfer (SWAT) package is a Python interface to CAS. With this package, you can load data into memory and apply CAS actions to transform, summarize, model and score the data. You can still retain the ease-of-use of Python on the client side to further post process CAS result tables.
But before you can do any analysis in CAS you need some data to work with, and a way to get to it. There are two components to data access in CAS: caslibs and CAS tables. Caslibs are definitions that give access to a resource that contains data. When you want to analyze data from a caslib resource, you load the data into a CAS table. A CAS table contains columns of data and information about the data in the columns.
CAS Action sets include many of the methods defined by Pandas DataFrames. So, if you are familiar with the Pandas Data Analysis Library, CAS actions should come naturally. CAS enables you to subset tables using Python expressions. Using Python, you can create conditions that are based on the data pulled, instead of creating the conditions yourself. SAS® will use the information you want pulled to determine which rows to select.
For example, rather than using fixed values of rows and columns to select data, SAS can create conditions based on the data in the table to determine which rows to select. This is done using the same syntax as DataFrames. CASColumn objects support Python’s various comparison operators and builds a filter that subsets the rows in the table. You can then use the result of that comparison to index into a CASTable. It sounds much more complicated than it is, so let’s look at an example.
The examples below are from the Iris flower data set, which is available in the SASHELP library, in all distributions of SAS. The listed code and output are produced using the IPython interface but can be employed with Jupyter Notebook just as easily. See this Github repository page for the Jupyter notebook code used in this article.
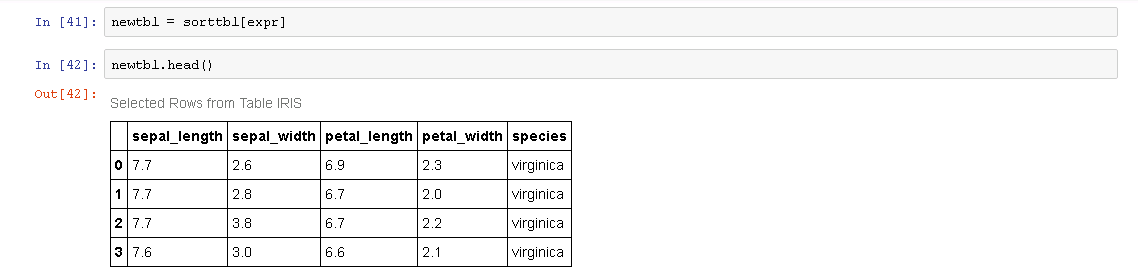
If we want to get a CASTable that only contains values where petal_length is greater than 7, we can use the following expression to create our filter.
![]()
Behind the scenes, this expression creates a computed column that is used in a WHERE expression on the CASTable. This expression can then be used as an index value for a CASTable. Indexing this way essentially creates a boolean mask. Wherever the expression values are true, the rows of the table are returned. Wherever the expression is false, the rows are filtered out.
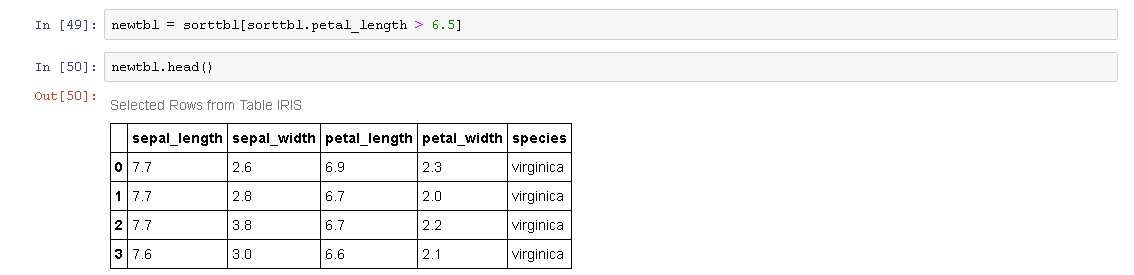
These two steps are more commonly done in one line.
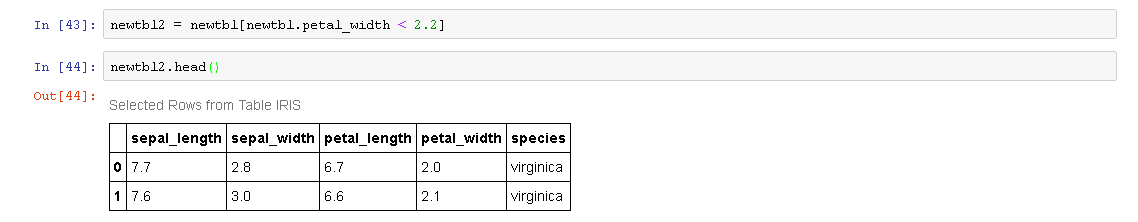
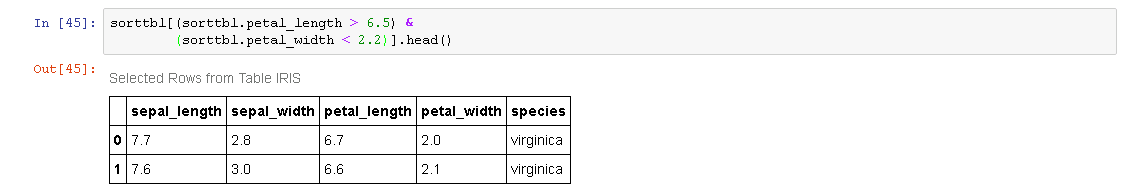
We can further filter rows out by indexing another comparison.
Comparisons can be joined using the bitwise comparison operators & (and) and | (or). You do have to be careful with these though due to the operator precedence. Bitwise comparison has a higher precedence than comparisons such as greater-than and less-than, so you need to wrap your comparisons in parentheses.
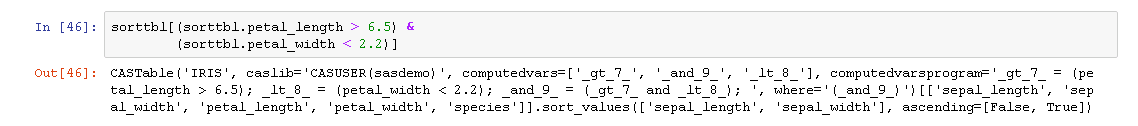
In all cases, we are not changing anything about the underlying data in CAS. We are simply constructing a query that is executed with the CASTable when it is used as the parameter in a CAS action. You can see what is happening behind the scenes by displaying the resulting CASTable objects.
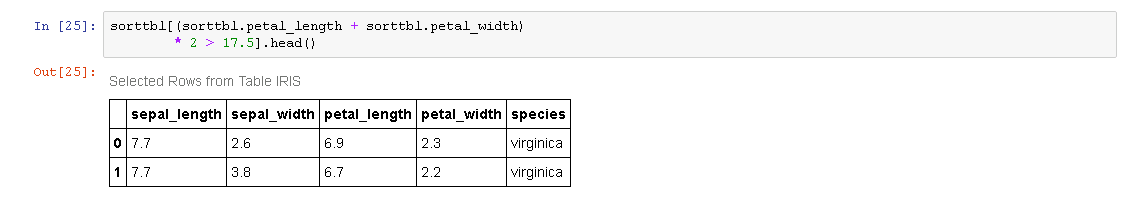
You can also do mathematical operations on columns with constants or other columns within your comparisons.
The list of supported operations is shown in the table below.
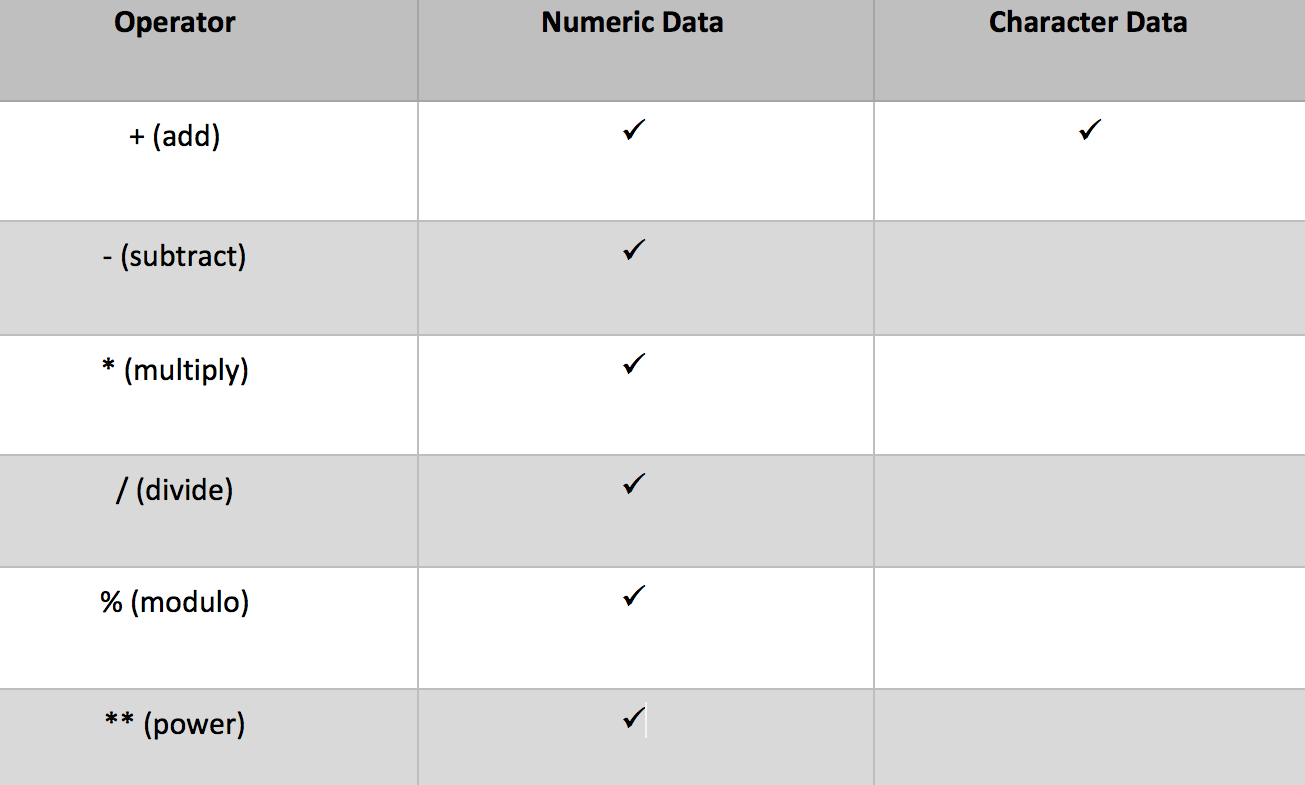
The supported comparison and operators are shown in the following table.
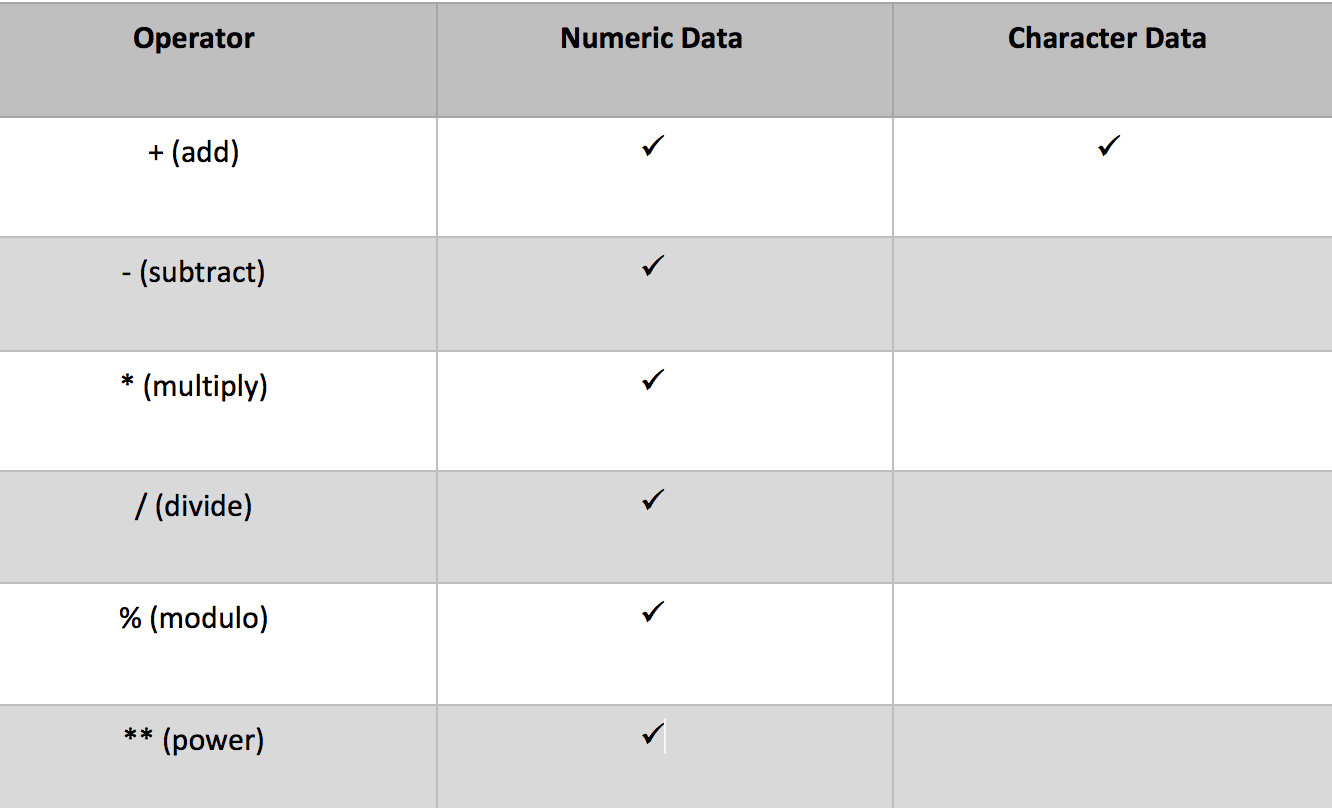
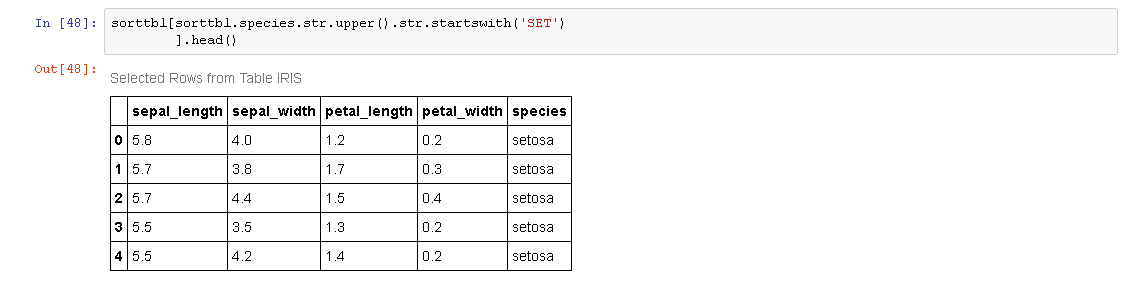
As you can see in the tables above, it is possible to do comparisons on character columns as well. This includes using many of Python’s string methods on the column values. These are accessed using the str attribute of the column, just like in DataFrames.
This easy syntax allows the Python client to manipulate data much easier when working in SAS Viya.
Another great tip? The Python client allows you to manipulate data on the fly, without moving or copying the data to another location. Creating computed columns allows you to speed up the wrangling of data, while giving you options for how want to get there.
Want to learn more great tips about integrating Python with SAS Viya? Check out Kevin Smith and Xiangxiang Meng’s SAS Viya: The Python Perspective to learn how Python can be intergraded into SAS® Viya® —and help you manipulate data with ease.
