 The SAS Environment Manager Report Center is a set of SAS stored processes and SAS macros which leverage the SAS Data Mart for the purpose of monitoring and auditing a SAS installation. Full documentation on the structure and functioning of the Data Mart can be found in the SAS Environment Manager 2.5 User’s Guide. This blog discusses functionality available as of the SAS 9.4 M3 release.
The intent of the Report Center is to provide most of the reporting that a SAS administrator might need “out of the box.” However, there’s lots of customization possible without doing any coding at all. You do, however, need to know something about your data, and, it helps if you’ve also got some knowledge of SAS reporting and graphing procedures. Those procedures would include PROC TABULATE, PROC TEMPLATE (for plots), PROC GPLOT, and PROC REPORT. This blog will explore a few things I’ve discovered about using the parameters to produce customized reports. In later blogs I’ll discuss using some of the reporting templates provided.
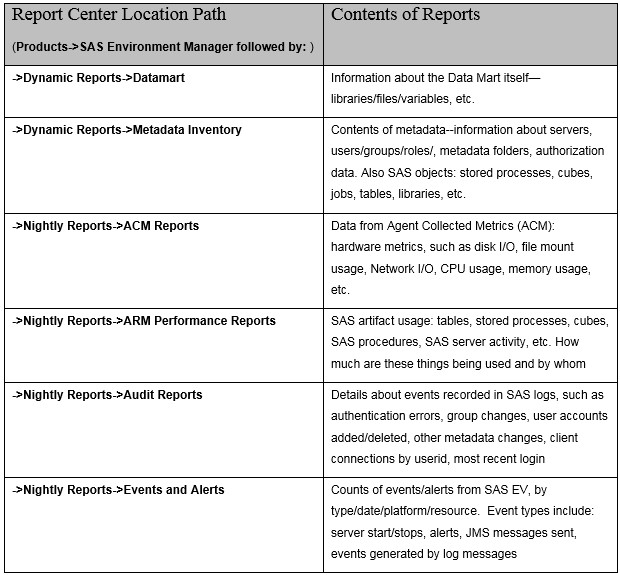
The first step is get a feel for the organization of the report center. Here’s a table to summarize what’s in it:
Often the first portions of the Report Center to be exploited are these three:
- ARM Performance Reports
- Audit Reports
- ACM Reports
So, we’ll use these three as examples.
If you open ARM Performance Reports, you’ll find all the data about SAS artifacts, how much they are being used, and who is using them. SAS artifacts include such items as Stored Process Servers, Workspace Servers, tables, cubes, stored processes, OS directory usage, SAS procedure usage, and stored process times elapsed. They also report which users are using which types of SAS artifact. You can get Workspace Server load distribution by hour, and number of workspace server sessions broken down by day. This is a great first step for a SAS administrator to know what’s going on in his/her production deployment.
As for customizing, you’ll see this menu for all the ARM Performance Reports (and nearly all other reports as well). You get to choose:
1. Number of observations to print in report
2. Subsetting, by begin/end date of data, WHERE clause
3. Look and feel: output format, ODS style
4. Debugging options: show SAS log, macro calls/parameters, and macro generation (using the debug level selector)
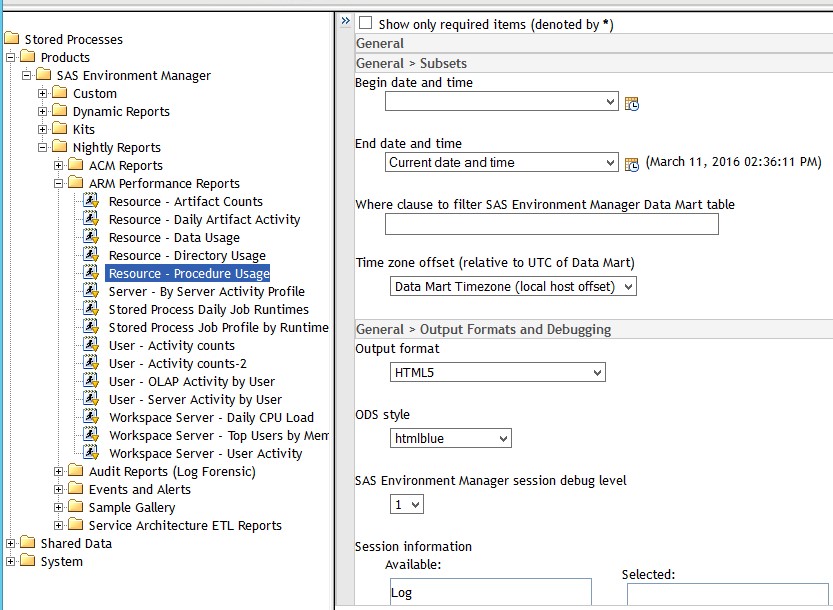
Careful: The WHERE clause is free-form, so you must know your variables names, types, and reasonable or valid values, or you will get errors.
The next interesting collection of reports in the Report Center is the Audit Reports, where you’ll find reports on all the events that could be scraped from SAS logs, such as:
- Authentication errors
- Group membership changes
- Changes in user accounts
- Other metadata changes
- Client connections by userID
- Most recent login for each userID
The most complex set of data is reported on by the ACM Reports (Agent Collected Metrics). This encompasses all the data that the SAS Environment Manager collects in its normal operations. As you would expect, a great deal of this data is the same as what you’d see when examining the metrics in SAS Environment Manager using the Resources->Browse menus.
ACM reports typically provide far more parameter options beyond the usual Titles, Footnotes, Date/Time ranges, and WHERE clause. This makes them far more customizable once you’re familiar with the additional parameters. For example, you typically have a prompt screen like the following:
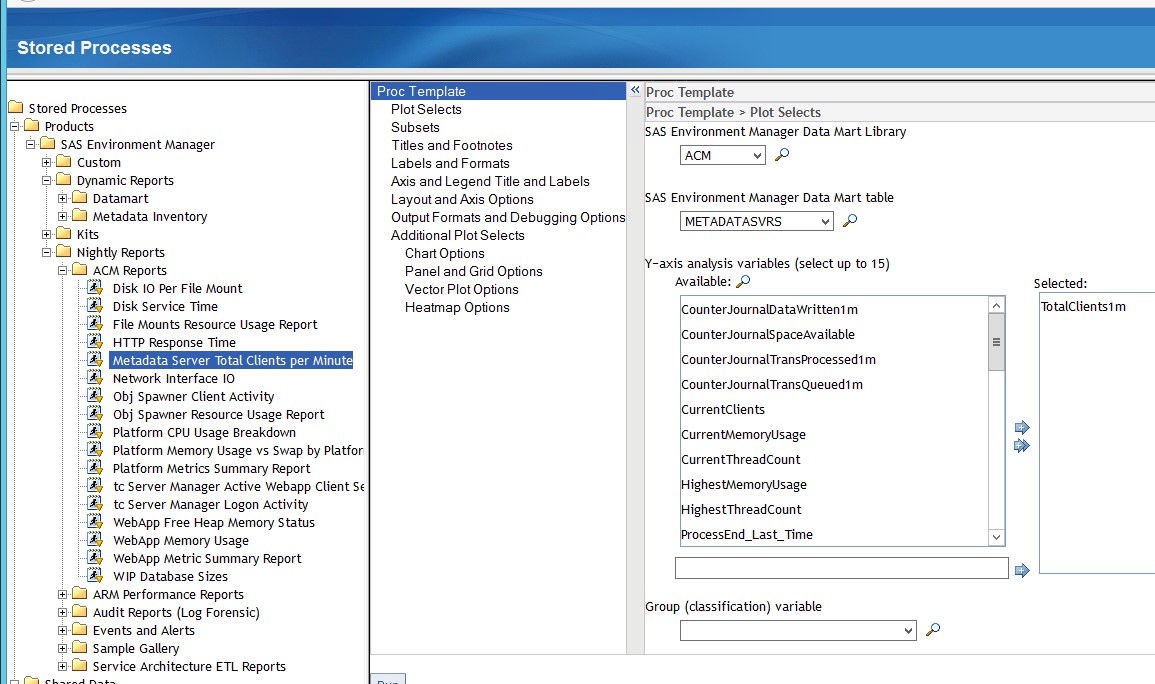
You can choose your data set, variables to display, many plotting options, X-axis and Y-axis variables and labels, BY groupings, layout and axis options, and many more. Plus, of course, the standard selectors for time/date, WHERE clauses, Titles and Footnotes.
So the lesson here is: Know your data, know something about plotting/graphing in SAS and what the terms mean, be willing to experiment and have a little patience. With these assets you can get literally hundreds of great tables and graphs.