We all know that alerting is one of the most powerful features of SAS Environment Manager; the flexibility and comprehensiveness of this feature is one of the things that makes SAS EV stand out among monitoring tools.
If we dig a little deeper, we find that we have quite a bit of control over how we get our alert notifications. Assuming that we want the alert notification to occur on the SAS EV interface (there are other methods), we can adjust how we use the various dashboard portlets to optimize the experience for the administrator. However, before doing that, it’s best to get some practice with a test version of the system. This is largely because:
- If you are using the Service Architecture Framework (M3 release), you’ll find a large number of pre-built alerts. Many of these may need to be adjusted (or turned off completely) to optimize a given system. The thresholds that determine when an alert will fire can easily be adjusted up or down.
- You need to get some sort of idea of how often various alerts are expected to fire, in order to gauge how you want them displayed on the dashboard interface. There may be some alerts that you would expect to fire with some regularity, and thus would not suggest a serious problem. There will be others that mean something severely wrong has happened with your system.
Once you have some idea of which alerts you’re most interested in, and how often you would expect them to fire, you can proceed with your dashboard design. To do this you can use some combination of the following four supplied portlets:
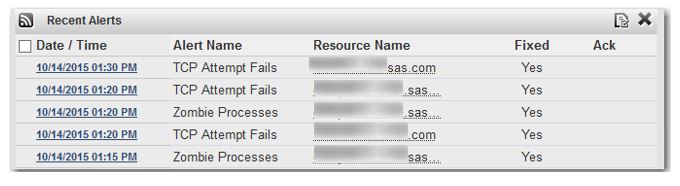
- Recent Alerts: lists all alerts chronologically, most recent first
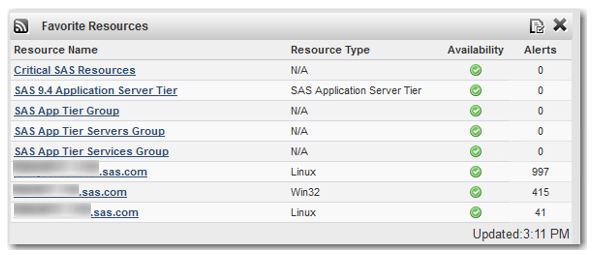
- Favorite Resources: displays a pre-specified set of resources or resource groups and the total number of alerts for each
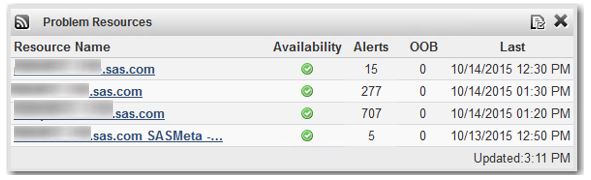
- Problem Resources: displays only those resources that have had one or more alerts triggered, within a specified time period
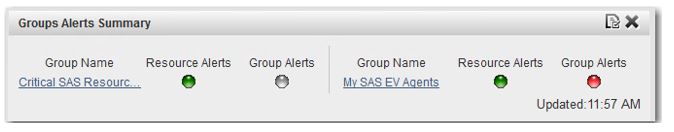
- Group Alerts Summary: for resource groups only, displays either:
- Whether any alerts, of any kind, have fired on any member of that group (Resource Alerts), or
- Whether a specific alert has fired on any member of that group (Group Alerts)
First, a couple of definitions:
Group alert – This is a special type of alert, defined as one particular metric going out of bounds for any of the resources in a compatible group. All resources must be of the same type (a compatible group), since they must all share that particular metric.
Mixed group – a group of resources of different resource types, such as a group containing all SAS IOM servers, (workspace servers, pooled workspace servers, and stored process servers)
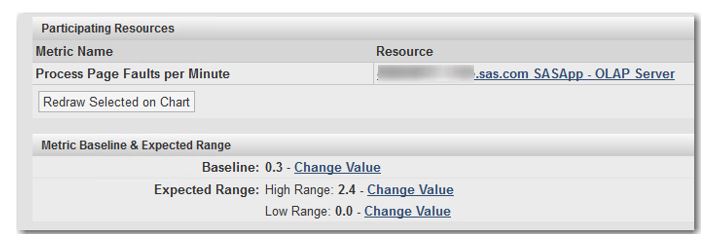
Out Of Bound metric (OOB) – A metric that has been measured outside the “normal” bounds of its range, as determined by its metric baseline and expected range. These numbers can be found on the details page for any metric. To view, click on any metric in any chart, as shown below.
Some alerting guidelines follow from this:
1) If you’re monitoring very frequently, and don’t expect many alerts except very serious ones, you may be able to get along with just the Recent Alerts portlet shown below. Pro: You can set the time range to display alerts occurring anytime within the past 30 minutes to up to 1 month; you can subset the view to alerts of a specific priority or for specific resources. Con: It doesn’t show the number of alerts per resource or resource group; it can be quickly overwhelming if you have a lot of alerts; if you limit the display to specific resources, you may miss some important alerts.
2) If you want to focus on a small set of important resources among many resources, then the Favorite Resources portlet would be suitable (see below). It also allows you to specify resource groups in addition to individual resources, giving you more leverage if you have a very large number of resources to watch in one space. Pro: You can include groups Con: It simply displays a total accumulation of ALL alerts for each resource and resource group, and you can’t limit the time frame. Also you could miss some alerts on resources that you failed to specify.
3) If you expect a large number of alerts and you want to be apprised of all of them, then the Problem Resources portlet would be suitable. Pro: With this portlet, you can specify the time period to display: showing the preceding 1, 4, 8, 24, or 48 hour period. In addition to alerts, you can specify Out of Bound (OOB) metrics. And, it shows the time of the most recent alert for each resource. Con: This portlet doesn’t allow resource groupings, only individual resources.
4) If you want to watch resource groups rather than individual resources (for example, you have a large number of resources, or you want to single out and group some resources that are much more critical than others), then the Group Alerts Summary portlet may do the trick. Pro: You get a higher-level picture over a large number of resources; you can create your own custom groups; it’s the only portlet that will display a Group Alert (see definition above). Con: Only shows WHETHER there’s been an alert for a group (via a traffic light), not what that alert specifically is; does not show alerts on individual resources.
The Group Alerts Summary portlet also has a different approach to alert history, compared to the other portlets: if the administrator FIXES all alerts related to a group, that is, all alerts that would cause a light to turn red, then the green light comes back on and there’s no record remaining for that group. The other portlets allow you to look back on the history of the alerts, depending on the portlet settings, even if those alerts are fixed and no longer relevant.
As you can see, none of the portlets does everything, and each has its own particular advantages and drawbacks for detecting and viewing alerts. And of course you can use any number or all of the above-mentioned portlets on a given dashboard. With some careful planning up front and some knowledge of what to expect from your alerting “system,” you should be able to design a dashboard that allows you to focus on your alerts effectively.