➤ DISCLOSURE!
 In my previous post SAS ODS destination - Google maps I showed how to incorporate SAS ODS output into Google maps using Google Map’s InfoWindow – that ubiquitous bubble window that opens up on a Google map, that can be used to display all sorts of different information (see also The power of SAS-generated InfoWindows in Google maps).
Two-pane solution
While the InfoWindow approach is fine by most measures, in some cases it can be rather clunky. When SAS output is quite large, displaying it in a Google map’s Info Window will either require a larger Info Window size, which will obstruct the Google map area on the screen, or it will require horizontal and vertical scrolling within the Info Window, which is also not the best approach from a usability standpoint.
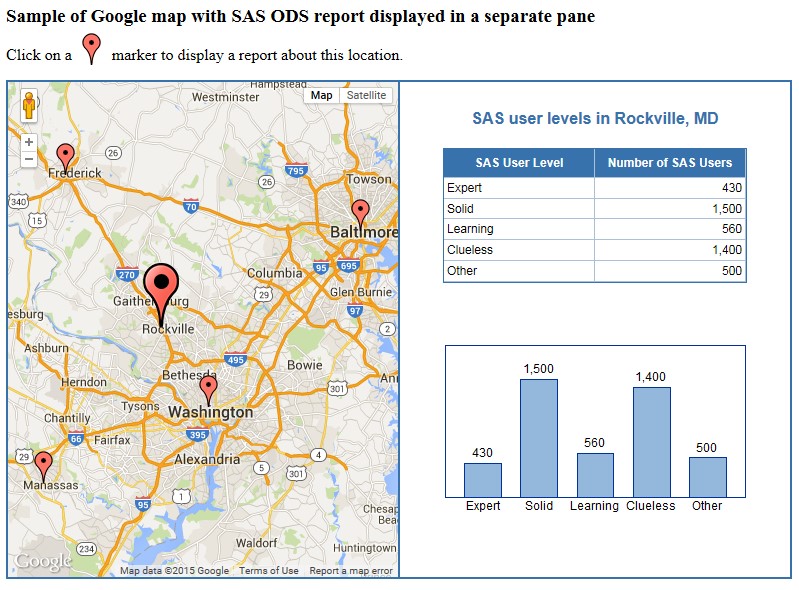
Here, I am going to demonstrate a different design solution when a computer screen is divided into two panes: one pane is used to display a Google map with all its interactive features; another pane is used to display a SAS report, based on the interaction with the Google map pane.
Here is an interactive example of the 2-pane solution. Before proceeding to the “How it is done” section, please take a couple minutes to explore this demo (the data itself is fictitious and serves the purpose of illustrating the technique only). Make sure to click on Google map markers to navigate between SAS reports.
How it is done
Click to view and download the full sample SAS code. In this code, I capitalized on my prior posts on Google map with SAS. In particular, I used the framework of creating mini-pages for each location described in SAS ODS destination - Google maps.
The main difference here is that the HTML mini-pages (place1.html, place2.html, etc.) for each geographical location are displayed in a separate pane rather than in the InfoWindow. For that I also use <iframe src=”. . .”> :
put '<iframe id="report-pane" src="infopages/place0.html" width="300" height="150">';
However, the key here is an event handler for each marker on the Google map:
put
  'google.maps.event.addListener(marker' i ', "click", function() {' /
  'document.getElementById("report-pane").src="infopages/place' i +(-1) '.html";' /
  'resetIcons();' /
  'marker' i +(-1) '.setIcon(iconbig);' /
  '});'
;
In this event handler (event listener), I replace src location with a corresponding to that location mini-page and replace icon image with a larger icon.
When a user clicks on a marker, this event listener immediately executes replacing SAS report in the right pane and also changes the last clicked on marker with a larger image to signify an active location – the one for which the report is displayed.
For “SAS report” I chose a combination of a table produced with PROC REPORT and a graph produced with PROC GCHART, but it could be a combination of the output from any mixture of SAS procedures.
Would you share your thoughts on this 2-panel design for combining Google Maps with SAS output?

4 Comments
I am trying to embed a google map into a larger report project that will ultimately print out as a pdf.
I want it to be interactive. Any ideas? I just want to embed it like you would a picture on a pdf, but the differences between SAS pdf and html are getting me hung up.
Jose, interesting idea! I have never done Google Maps within PDF, but it seems that you would need to use JavaScript for Acrobat API Reference since Google Map API is JavaScript-based. Would love to hear from you whether you are able to make it work.
Hi Leonid,
I really liked this demo, it’s straightforward and useful.
Wanted to ask you whether it would be possible to include the screen split in the listener, such that the second screen appears only when we actually click on a marker?
Thanks,
Diana
Diana,
Thank you for your feedback. I am sure it is possible. For that, I would initially set the visibility style property of the right pane to “hidden”, then in the event listener modify it to “visible”. Actually, I just made a quick code modification to accomplish just that, see it here: http://www.lenetek.com/sasblog/gmap_sas_reports_2_panes/gmap_sas_reports_for_diana_maris.html.
To see what exactly I have done, just go to the View Page Source.