An Info Window is a SAS Visual Analytics pop-up window that provides additional information when a user selects a report object. When designing your report, you can think of an Info Window as simply an additional report section that is defined as hidden.
Now that you know what an Info Window is, what can you put in it? The beauty of it—anything you would a typical report section! Well, except report and section level prompts, that is.
I think one of the Info Window’s benefits is being able to provide that extra level of detail for a report object without navigating off the current report section. Info Windows can include:
- prompts in the report body
- text to give your users more information on the data source refresh schedule, system maintenance schedule, or system administrator contact information
- any additional report objects with or without hierarchies to allow access to additional pieces of information to help explain dashboard numbers.
So, if it’s hidden, how do report users access it? Since the Info Window is a hidden report section, you must define an interaction from a source object to the Info Window (aka, hidden report section), and the target object will be the pop-up Info Window. Let’s look at how to configure a report section as an Info Window.
How to configure a report section as an Info Window
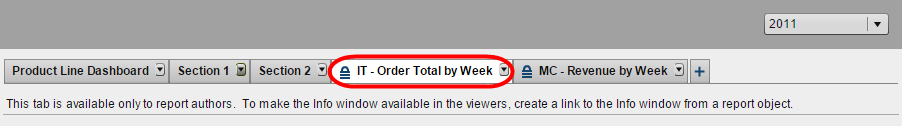
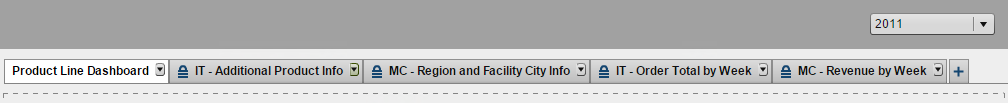
In this example report, you can see it contains three normal sections and then two sections that have a lock to the left of the name. That lock represents an Info Window, and the tool tip below reminds report designers that:
“This tab is available only to report authors. To make the Info window available in the viewers, create a link to the Info window from a report object.”
I have Section 1 and Section 2 designed to be Info Windows. To make a section an Info Window, use the section’s drop down menu and select Display as Info Window.
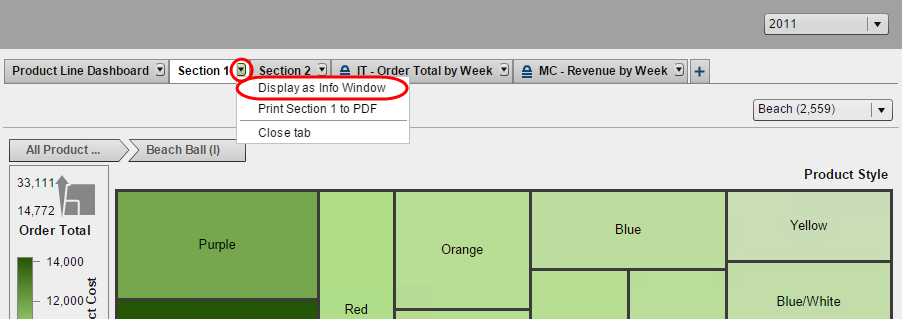
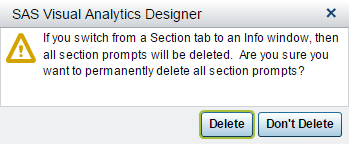
Notice that I have a section level prompt defined. I know this will be removed once I define this section as an Info Window, but it made designing the section easier since I knew this was the parameter that was going to be passed from the source object.
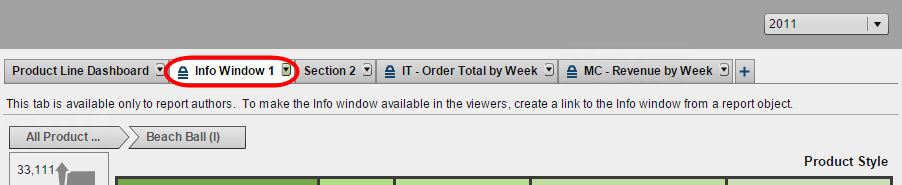
Now my Section 1 has been defined as an Info Window and automatically renamed to Info Window 1. If you like, you can rename this section. This is why I didn’t bother renaming my Section 1 and Section 2 earlier, when you assign a section to be an Info Window it automatically is renamed for you.
I’ll go ahead and assign Section 2 to be an Info Window as well and rename my sections. The “IT” and “MC” prefixes on my sections represent my data sources. IT stands for Insight Toys and MC stands for Mega Corp. Since my dashboard is using two different data sources, I ended up creating two Info Windows per data source.
So even though this report has five sections, the viewer will only see one section, the main Product Line Dashboard section.
How to create the interaction between report objects and Info Windows
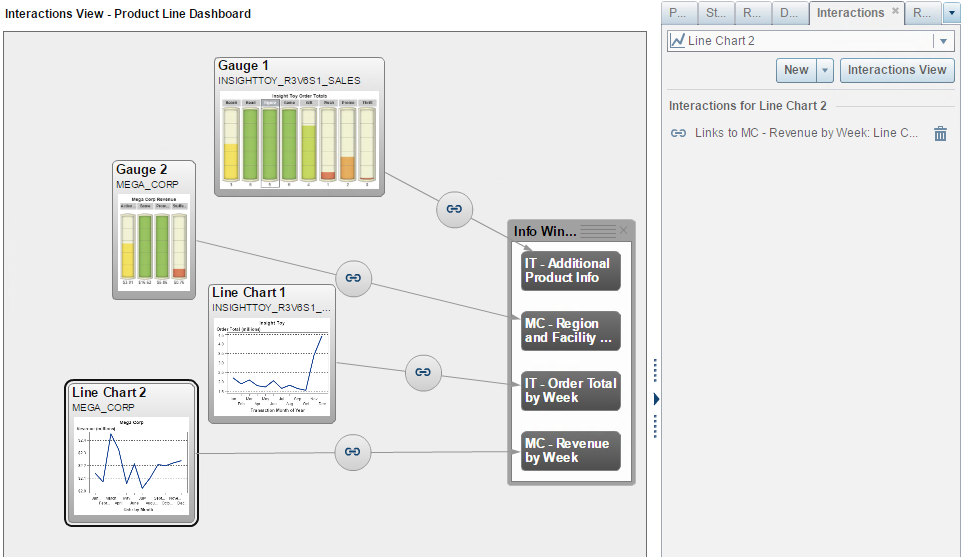
Don’t forget to create the interaction between your Info Windows and your main report objects! Otherwise, your viewers will have no way to open the Info Window sections. You can do this from the Interactions tab using the Interactions View and drawing connections between the source objects and target Info Window sections.
How Info Windows are used in this report
Let’s look at some screenshots from the Product Line dashboard and see how these Info Windows display at viewing.
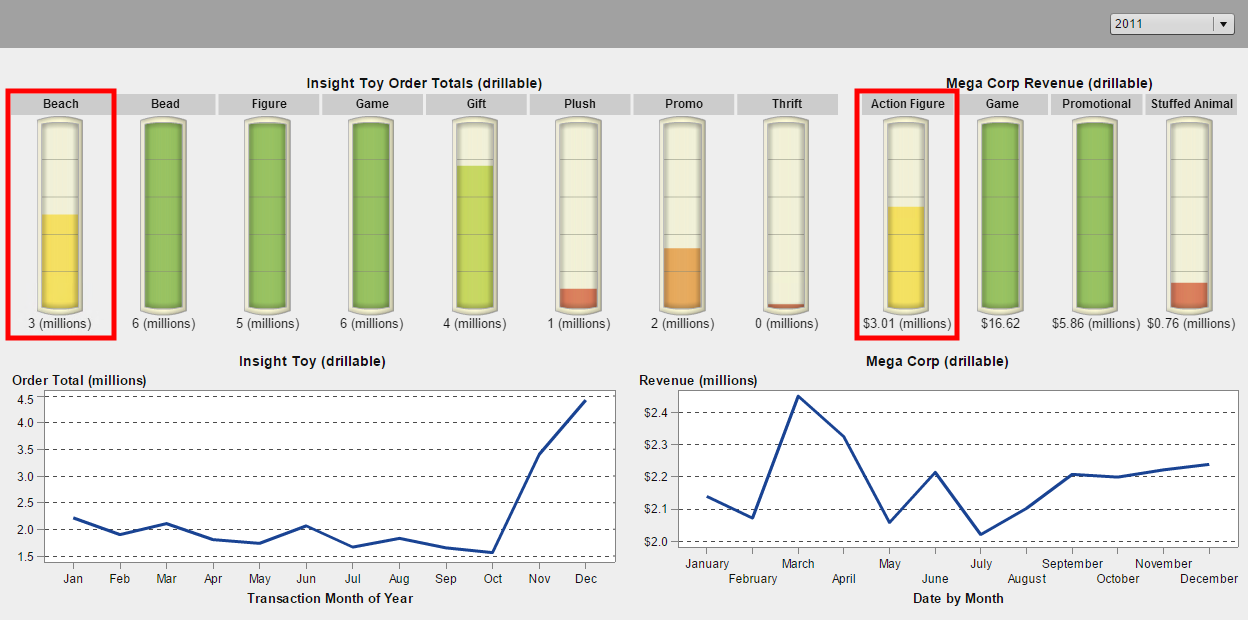
First, here is the Product Line Dashboard. The red squares highlight Insight Toy’s Beach Product Line and Mega Corp’s Action Figure Product Line. These are the Product Lines which I will be double-clicking on to open the linked Info Windows.
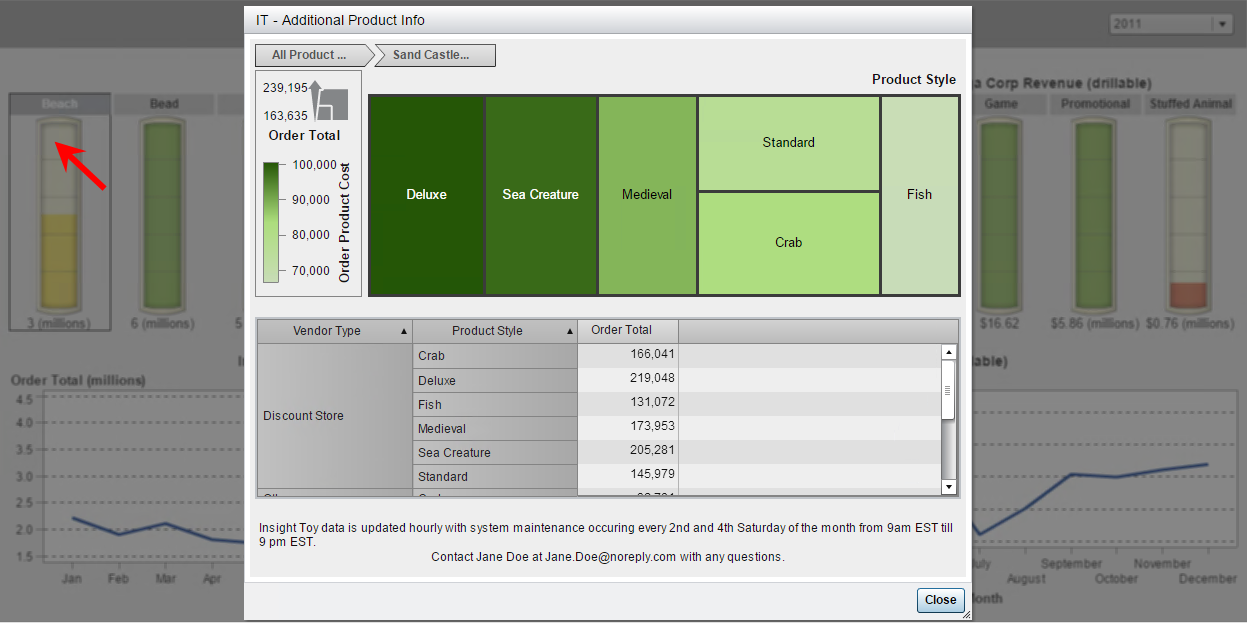
Here is the Info Window that pops-up when I select Insight Toy’s Beach Product Line. In this Info Window, I have a Tile Chart that uses a hierarchy that filters the Crosstab down below. I also have a Text box at the bottom that lets the user know how often the data is refreshed, system downtime, and who to contact if there are questions.
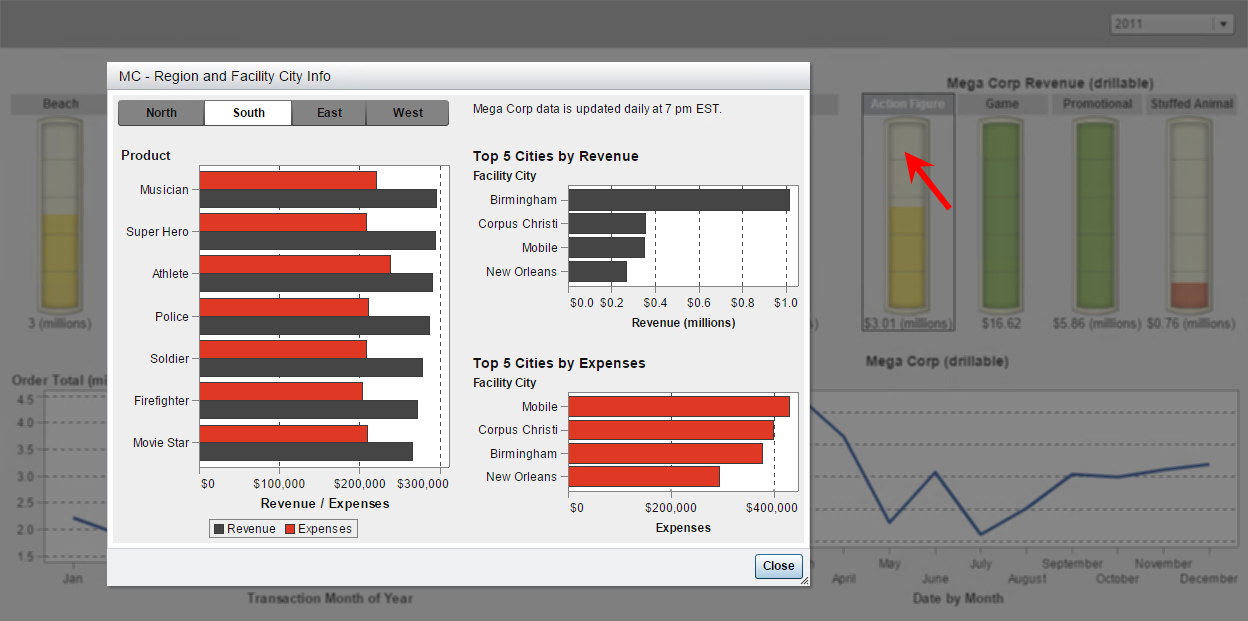
Here is the Info Window that pops-up when I select Mega Corp’s Action Figure Product Line. In this Info Window, I have a Button Bar that allows the viewer to look deeper into the Product Line by Region and then see the Revenue vs Expenses for the Products and Facility Cities.
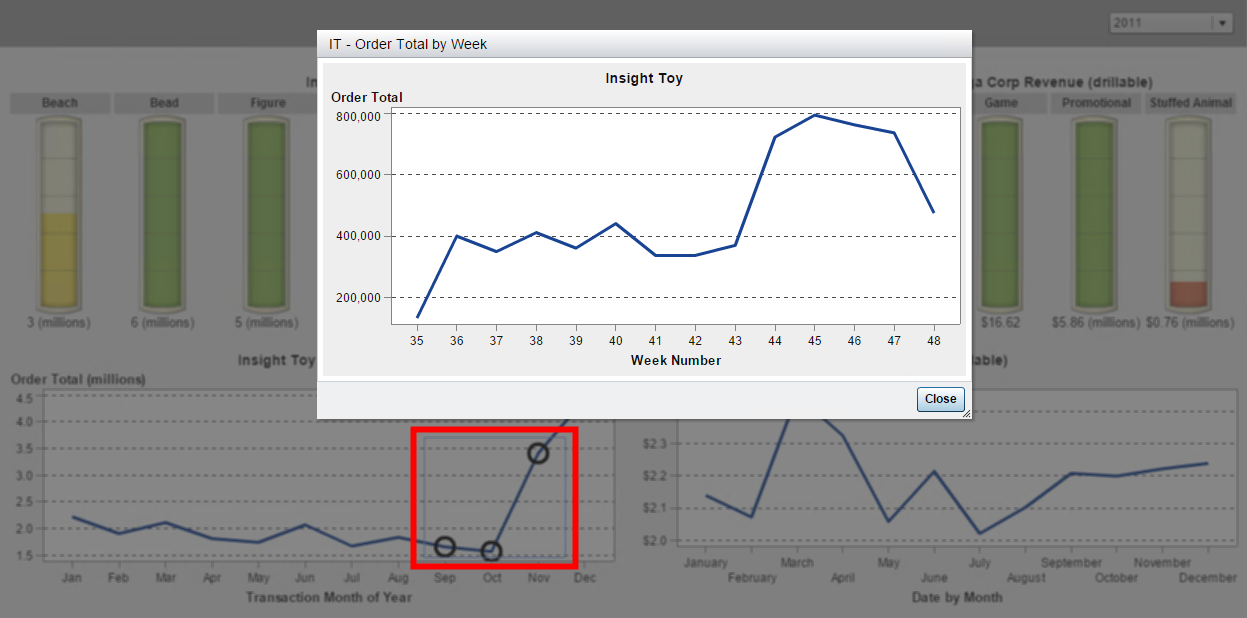
The two bottom Line Charts have similar Info Windows, where you can highlight all the months or a subset of months and get the weekly detail in the Info Window.
These are just a few ideas of ways you can use Info Windows to support your SAS Visual Analytics reports.

3 Comments
Very Useful.
Just want to add that we could give multiple links like how Teri detailed. once we double click on the report, one could choose which every report they want to view. That is, we could create different reports at different dimensions and then select from the info window, which dimension report to view, as a pop up report.
Info windows can be very useful, but they could even be more useful when links to other reports would work.
Some great ideas to redesign a traditional report and provide extra info via the Info Window. I liked your walk thru and how you set up a section with a prompt to simulate a parameter passing while designing the report... Good tip!