The weighted average calculation is a useful metric that you should be familiar with. The more common calculation of average is the arithmetic mean, which assumes that each data point has an equal weight. Unlike the arithmetic mean, the weighted average takes into account the fact that some data points contribute more to the average than others. The calculations make use of relative weights assigned to each data point.
A weighted average is often used in Finance. One example is determining the number of shares outstanding in an organization. To get an accurate picture of these shares, the weighted average number of shares can be calculated by taking the number of outstanding shares and multiplying the portion of the reporting period covered. When you do this to each portion and sum the total, you obtain the final weighted average of shares. The downside of not using weighted averages is that otherwise, only the starting or ending number of shares for the year would be counted.
In another example, many universities use a weighted average for calculating grades and GPAs. Many colleges put more weight on core classes than those not required for a major or concentration. A weighted average can reveal a more accurate GPA, focusing on those grades that matter most.
Here are six easy steps for calculating a weighted average in SAS Visual Analytics 7.1:
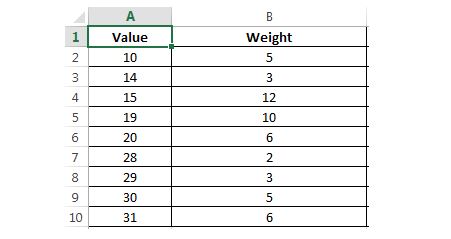
- You will need to have a data set with at least two columns: your values and your weights. To keep things simple, here is a screenshot of what our data looks like in Excel:
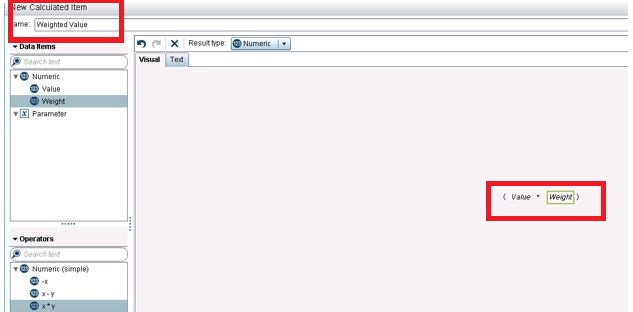
- Call your new Calculated Item “Weighted Value”. This new item will be calculated by multiplying your values by your weights, as shown below:
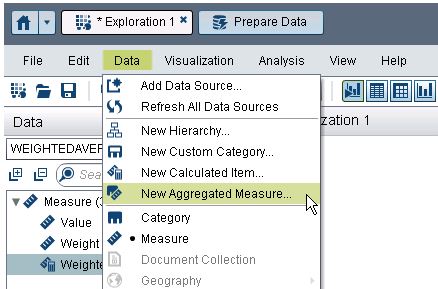
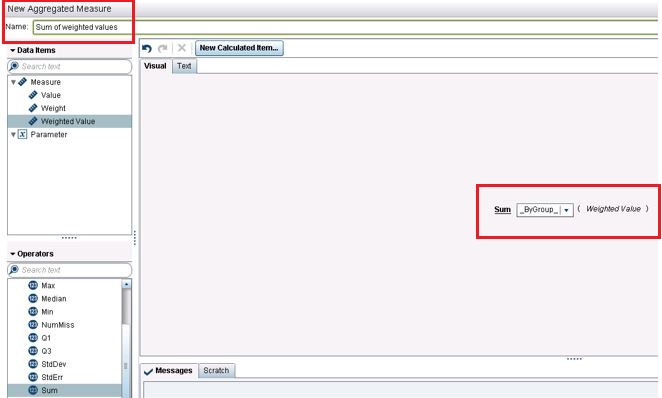
- Create a new Aggregated Measure by selecting “New Aggregated Measure” from the same “Data” menu drop-down you previously used, as shown below:
- Sum the weighted value, as shown below and call the new measure: “Sun of weighted values”.
- Next, you’re going to sum up all the weights. Repeat steps 3 and 4, but sum your weight variable instead and call your new measure “Sum of weights”.
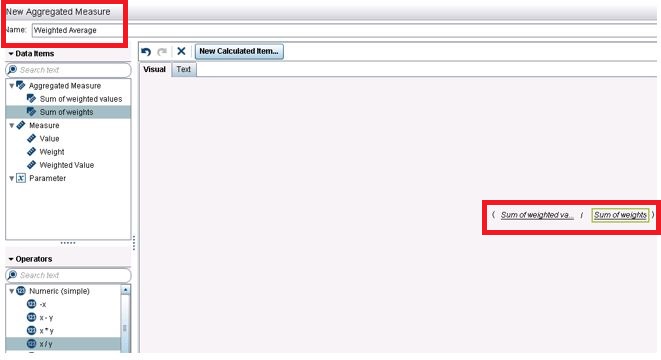
- You are now ready to create the weighted average. Create a new Aggregated Measure, as shown in step 3. Divide the sum of weighted values by the sum of weights and rename the measure to “Weighted Average”.
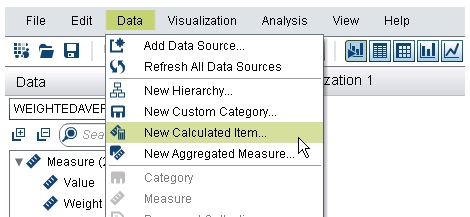
You can choose to import your data using the Visual Data Builder, or load it into LASR server through the Visual Analytics Administrator. Once your data has been loaded, open up a new Exploration window and select “New Calculated Item” under the “Data” menu item, as shown below:
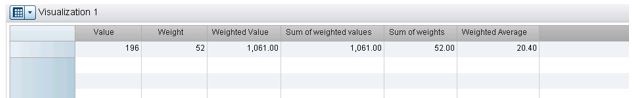
If you want to verify your work, simply drag all your variables, calculated items, and aggregated measures to the work space and visualize them as a crosstab.

2 Comments
Just what I was looking for, thanks!
Hi Varsha,
Can you please share the steps for weighted standard deviation in SAS VISUAL ANALYTICS.
Thanks