SAS Learning Post
Technical tips and tricks from SAS instructors, authors and other SAS experts.
A SAS practice exam can help you prepare for SAS certification. Practice exams are similar in difficulty, objectives, length, and design of the actual exam. While there's no guarantee that passing the practice exam will result in passing the actual exam, they can help you determine how prepared you are for an exam.

SAS variables are variables in the statistics sense, not the computer programming sense. SAS has what many computer languages call “variables,” it just calls them “macro variables.” Knowing the difference between SAS variables and SAS macro variables will help you write more flexible and effective code.

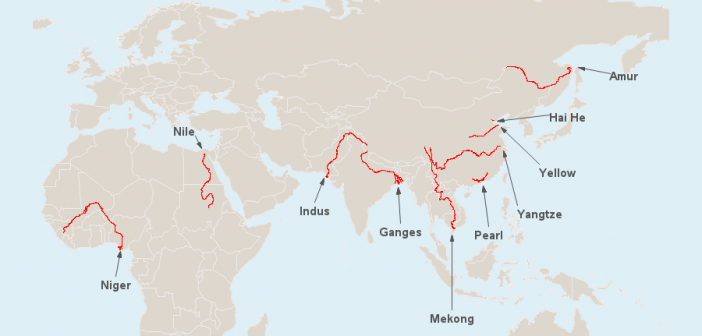
Plastic pollution in the oceans is becoming a huge problem. And, as with any problem, finding the solution starts with identifying the source of the problem. A recent study estimated that 95% of the plastic pollution in our oceans comes from 10 rivers - let's put some visual analytics to


