SAS Learning Post
Technical tips and tricks from SAS instructors, authors and other SAS experts.
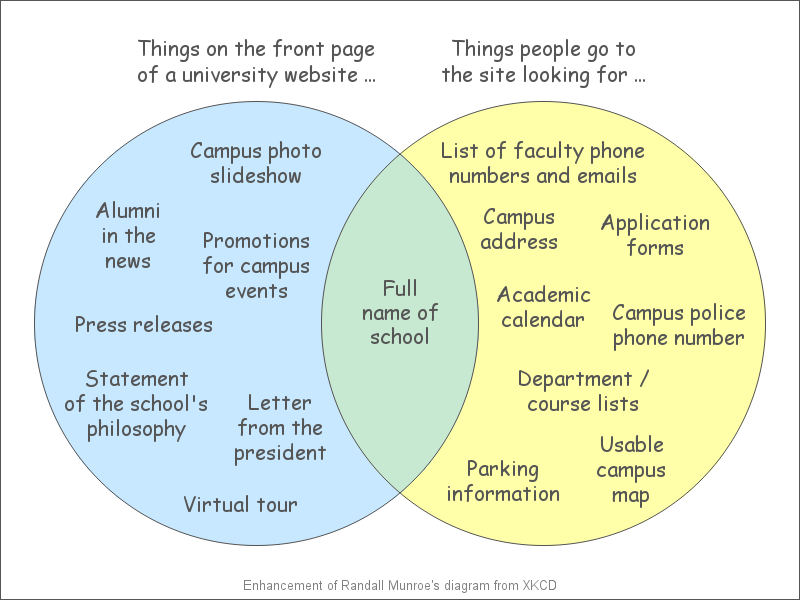
What information should you make easily available from the top page of your website? This Venn diagram might help you decide! Have you ever gone to a website to try to find some information, and had a (expletive) difficult time trying to find that info? I think there is often a

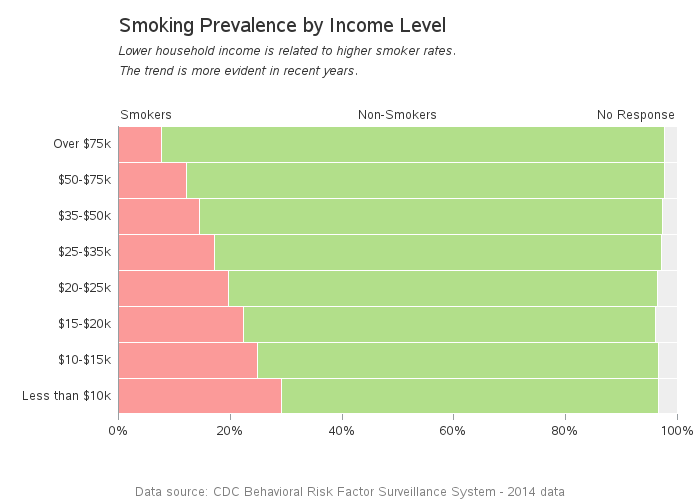
I've noticed fewer and fewer people smoking these days, and was wondering who the last holdouts are. Let's run some numbers and find out... Back in the 1950s, 60s, and 70s it seems like almost everyone smoked. You hardly ever saw the "cool kids" such as James Dean without a cigarette -

SAS Author Derek Morgan is a programming rock star… in more ways than one. Not only has he been a professional SAS programmer in the pharmaceutical industry for almost 30 years and written two editions of The Essential Guide to SAS® Dates and Times, Derek also plays electric bass in

