 This week's tip is from Professor Willbann D. Terpening and his book Statistical Analysis for Business Using JMP. If you're intrigued by the following excerpt, visit Terpening's author page for additional bonus book content. And take a look at his previously featured tip The Student t-distribution, on this blog:
The following excerpt is from SAS Press author Willbann D. Terpening and his book "Statistical Analysis for Business Using JMP: A Student's Guide" Copyright © 2011, SAS Institute Inc., Cary, North Carolina, USA. ALL RIGHTS RESERVED. (please note that results may vary depending on your version of SAS software)
The Concept of a Sampling Distribution
We are now ready to introduce one of the most central concepts in statistics, the concept of a sampling distribution. As shown in Figure 5.1, the purpose of a sampling distribution is to allow us to deduce what we will observe in terms of a sample statistic for a sample taken from a population with known parameters. The basic concept of a sampling distribution is a distribution of values of a sample statistic. For example, we can visualize taking repeated samples from a known population with certain parameters and building a distribution of values for the sample statistic as shown in Figure 5.19.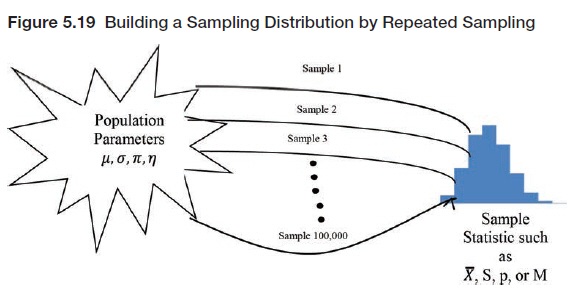
If we had such a distribution of values for the sample statistic, then we would know which values were more likely to occur in a sample of a certain size taken from this population. Obviously, it is not economically feasible to actually do this in practice, and, if we already knew the population parameters, there would be no reason to do this. Nonetheless, this notion of a sampling distribution is central to understanding statistical inference. However, the concept of a sampling distribution is often difficult for students to grasp. One reason for this is because sampling distributions are often discussed in two different senses without explaining their relationship. We will try to explain these two meanings of a sampling distribution in terms of a simple example.
Suppose that we have a very small class of five students and we know their ages. The students and their ages are shown in Table 5.2.
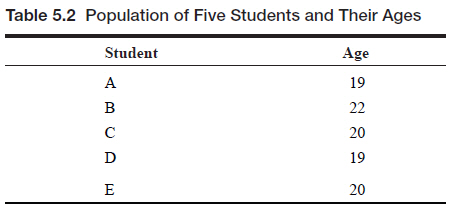
Let this be our population of interest. We can then easily calculate the average or mean of this population and find that the mean is![]()
We can also calculate the variance and standard deviation of this population using the equations from Chapter 4.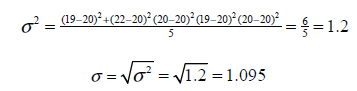
Since these values are calculated with the entire population, they are population parameters. Now suppose that we are going to take a random sample of size three from this population and calculate the average age of this sample (X ). We consider two ways of looking at this situation.