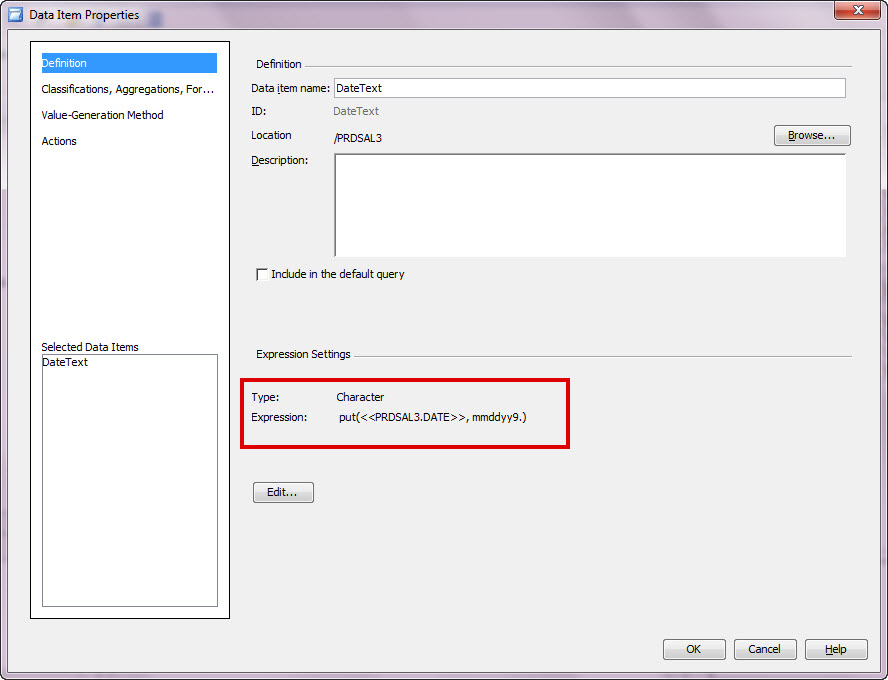
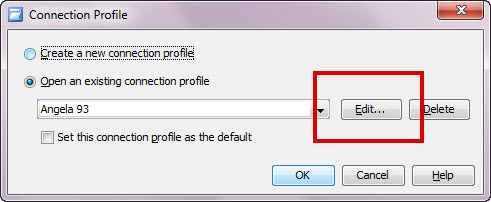
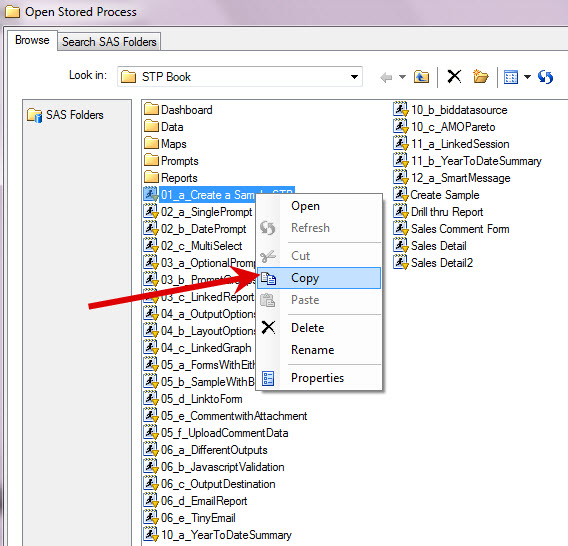
Last week I provided the steps for how to go on a date, at least by using dynamic prompts in BI Dashboard. Now that you have seen how to create them, lets discuss making them smarter. For this example, the customer is asking for two prompts to affect a single
English
You've all heard about the recent meningitis outbreak, right? Being a data-guy and a map-guy, I went looking for maps related to the outbreak. I found the following map on the Centers for Disease Control (CDC) website. It shows the states that received the recalled drug used in epidurals (for back
SAS/GRAPH gives you the ability to customize your graphs (or even create totally new types of custom graphs) ... and it is my firm belief that it gives you a competitive advantage by allowing you to "make sense" of your data in ways your competitors can't. Most of the examples in
By now, most of you probably already know how to add drill downs and hover text to your SAS graphs. But did you know you can add pop-up images and graphs? Here are a couple of examples ... In this first example, when you hover your mouse over each state, you
Dear Miss SAS Answers, I have read through a few Dear Miss SAS Answers blog posts, but I cannot seem to find what I am looking for. I need to extract only the second duplicate from a whole list of duplicates per account number. Is there a way to
Who says anyone is an expert at something? I definitely do not when it comes to SAS (well, anything for that matter). Each time I sit through a presentation at a conference I learn something new. During the SAS Western Users Conference, fondly know as WUSS, this month I learned
Facebook has millions of users, and therefore when people share an interesting graph on Facebook it can "go viral" and millions of people might see it. Some of the graphs are obviously a bit biased - especially ones that are trying to sway your opinion one way or another on a topic
Do you use SAS for analytics and Microsoft Excel for graphs? Why not use SAS for your graphs too?!? Then you could completely automate the entire process in one SAS program, with no manual steps! A lot of people use Excel to create their graphs because "it's what they know." What if somebody
Everyone in the world has their attention turned towards the Olympics this week, so what better topic to tie in to a SAS/GRAPH blog than that?!?! I had seen a graph on the guardian website that I thought was interesting, so I decided to try to create my own (slightly different)
Hopefully you know that a gif animation can be used for more than just showing a cartoon animal doing cute tricks! Being a savvy data-meister, I'm sure you are also aware that you can use gif animations to see how data changes over time. But perhaps you didn't know you could