With North Korea's growing missile capabilities in the news lately, I thought it would be interesting to create a map showing how far (or close) they are from other parts of the world. I first did a few searches on the Web, to see what maps are already out there.
English
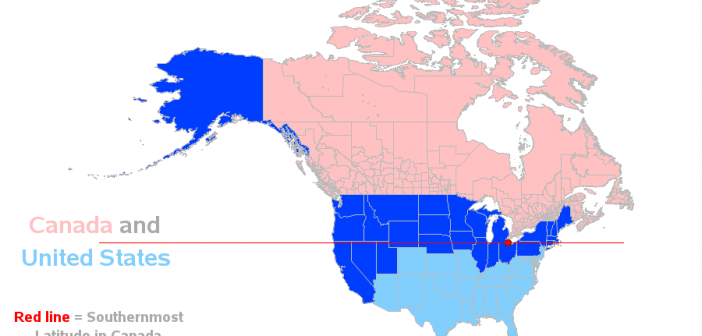
With all the recent talk about some people wanting to move from the US to Canada, I got to wondering how cold, and how far north Canada is. And after a few Google searches, I was surprised to learn that 27 US states are actually farther north than the southernmost point
In this post I describe the important tasks of data preparation, exploration and binning.These three steps enable you to know your data well and build accurate predictive models. First you need to clean your data. Cleaning includes eliminating variables which have uneven spread across the target variable. I give an
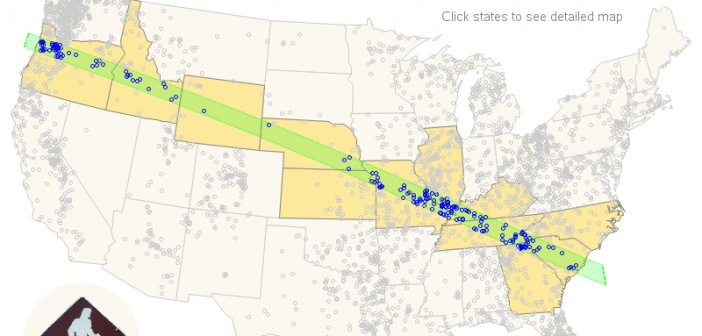
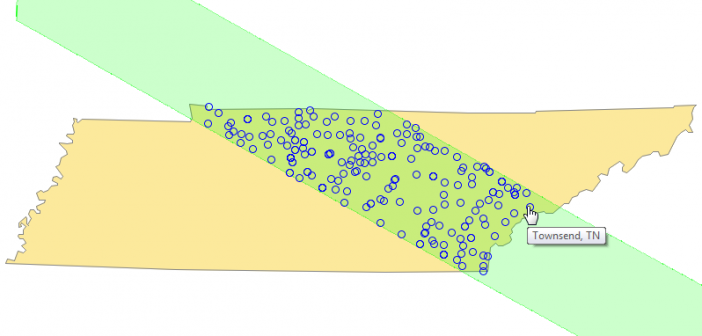
In the spirit of my Forecasting Sharknadoes blog post, I now bring you Sunsquatch! In this blog post, I create a map that helps you find a location where you can see the total eclipse *and* have a chance of seeing Bigfoot (aka, Sasquatch)! But before we get into the nitty-gritty
When I first started teaching JMP classes for SAS Education 10 years ago, I sat in to observe a colleague teaching our introductory JMP data exploration course. The students had lots of questions about using JMP for their own projects, and were excited to learn about all the capabilities of
There will be a total solar eclipse on August 21, 2017, and the umbra (total shadow) will pass right across the United States! As a data guy, a map guy, and an astronomy fan, this is an opportunity I just couldn't pass up! Follow along as I apply my computer skills
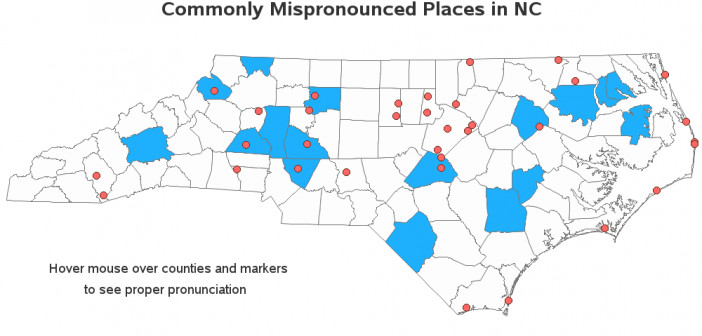
A lot of tourists flock to North Carolina. We have beaches, wreck diving, and lighthouses. We have the Great Smoky Mountains with whitewater kayaking, colorful fall leaves, and snow skiing. We have hot air balloon festivals & Scottish highland games. Oh, and some of the best barbecue you've ever tasted! But
I recently saw an interesting PEW study showing the percent of each state's revenue that came from federal funds. They had some pretty nice graphs ... but just like jell-o, there's always room for more graphs, eh! Let's start with the map. Their map had an informative title, a reasonable gradient
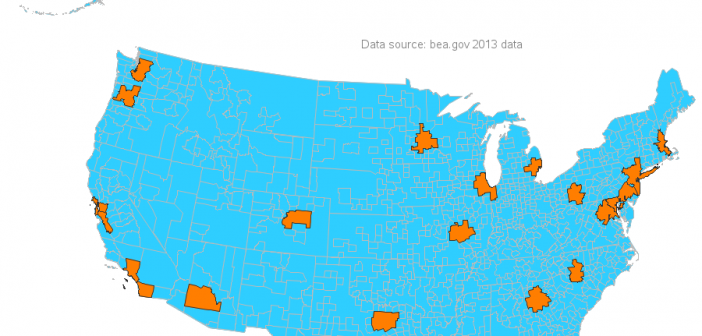
When it comes to economic activity, a handful of the largest metropolitan areas in the US account for lion's share. In 2013, the top 23 Metropolitan Statistical Areas (MSAs) accounted for 50% of the total US Gross Domestic Product (GDP). I recently came across a map created by Alexandr Trubetskoy
SAS is hosting the premier analytics conference in the world September 18-20 in Washington DC, and supplementing the event with discounted training and certification exams at SAS Analytics Experience 2017. These offerings will be held before and after the event. As at other SAS events, we will be offering certification exams at