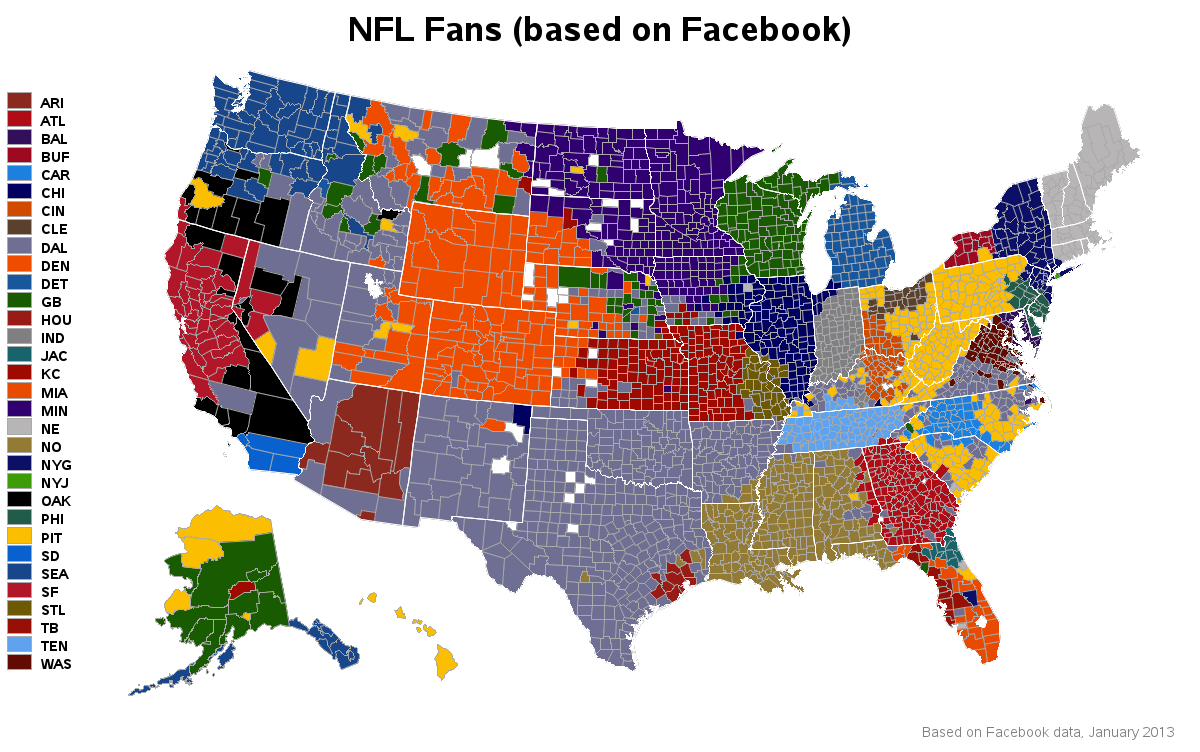
Are you an NFL fan, or curious about analyzing social media data? -- Well, in either case, this blog's for you! I recently read a fascinating Facebook article that included a U.S. county map showing which NFL (U.S. football) team had the most 'likes' in each county (based on ~35 million
Search Results: animation (33)
Visualizing NFL fans on a map, based on Facebook ‘like’ data
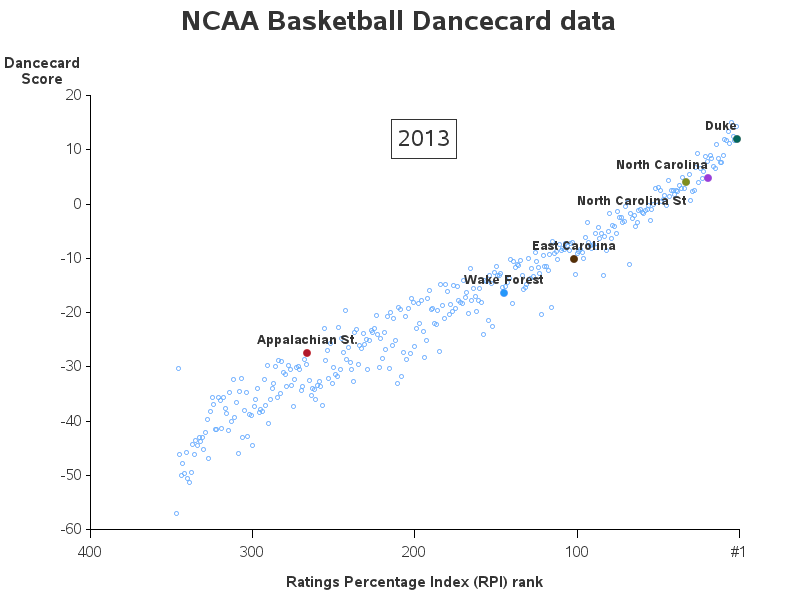
Basketball tournaments, Moneyball, and sports analytics
A big part of "winning" these days (be it sports or a business) is performing analytics better than your competition. This is demonstrated in awe-inspiring fashion in the book (and movie) "Moneyball." And on that topic, I'd like to show you a few ways SAS can be used to analyze sports data
Four reasons to use SAS/GRAPH
Robert Allison's SAS/GRAPH: Beyond the Basics collects examples that demonstrate a variety of techniques you can use to create custom graphs using SAS/GRAPH software. To celebrate the book’s publication, we asked Robert to tell us more about why he loves SAS/GRAPH. Here’s what he had to say: A graph is