With today being an election day here in the US, I see a lot of people wearing the 'I Voted' sticker. This got me wondering if I could create my own sticker ... using SAS software and simple graphics primitives. :-)
So I started by using Proc Gslide to create a blank image, and then annotated a circle on it using the 'pie' annotate function.
Next I added 180-degrees of red annotated pie, and 180-degrees of blue annotated pie:
Then I annotated a white 'box' in between the two pie slices, to provided room to write the 'I Voted' text. Here I show the box colored pink, so you can see it:
I then annotated the 'I VOTED' text onto the white area, using the annotate label function.
I then wrote a little loop, to count from x = 30 to 70 by 10, and annotated a white star at y = 25 and y=75 at each of the x-values. I used the 'ab'x character of the Wingdings font for the star character.
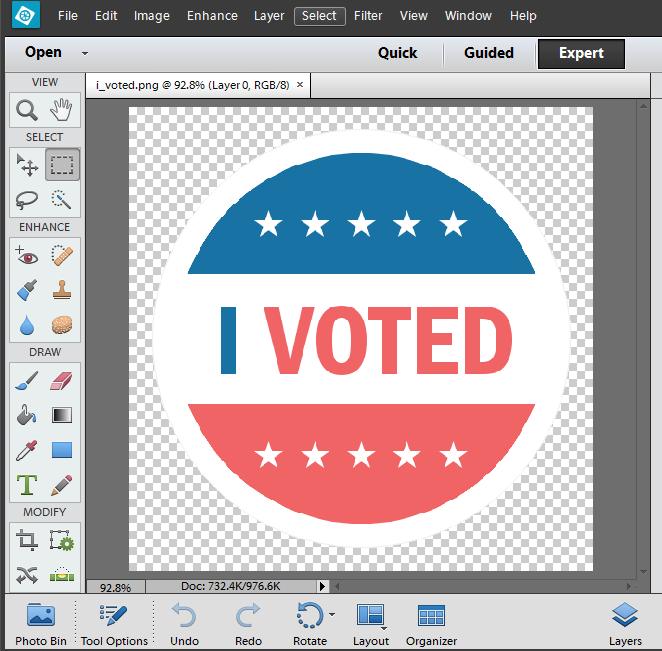
And there's one additional feature you can't really see here - I made the background transparent (using goptions transparency). This way, if you overlay it on top of another image, you'll just see the round sticker (not the rectangular boundary of the image file). Here's a screen-capture of the image in an image editor ... the checkerboard pattern denotes the transparent background.
Hopefully I've reminded you to vote, and you've learned a little something about creating custom graphic images. And if you're a SAS programmer, I invite you to download the SAS code, and modify it to create your own custom 'I Voted' sticker!









3 Comments
Awesome! thanks for the post.
Nice one. What image editor is that?
Photoshop Elements.