What strategy do you use to pick your lottery numbers? Do you suspect that the future winning numbers might be somehow related to the past winning numbers? If so, this blog's for you!
The Powerball lottery jackpot is up to about $1.4 billion - the largest lottery jackpot there has ever been ... in the history of the world!
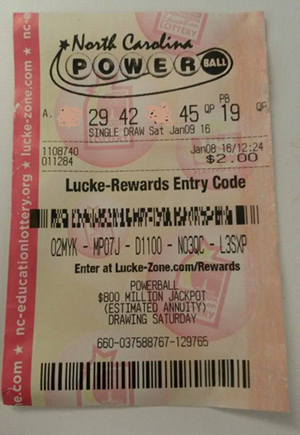
If you've never played the lottery before, here's what a lottery ticket looks like (thanks Paul!) Basically, you pay $2 and pick 5 numbers (two of which I've scribbled out in pink in Paul's ticket below, so you won't know his exact lucky number!) And if those 5 numbers are drawn, you win. If more than 1 person also picks the same winning numbers, then you have to split the prize with them.
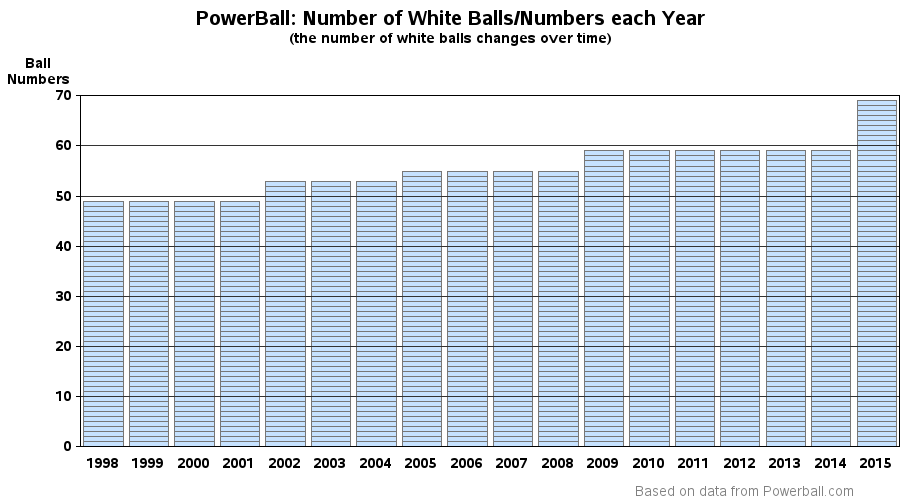
So, how do you go about picking your 5 lucky numbers? What's the min & max number range? Currently, you can pick numbers 1-69. The number range has changed over the years - in 2014 it was 1-59, and in 2005 it was 1-55. Here's a graph that shows the changes since 1998:
But what numbers are 'lucky'? Well that's the million dollar question! ... or actually, the 1.4 billion dollar question! Some people use birthdays, addresses, gym locker combinations, age, or phone number digits. Some people believe it's pretty well random. Some people believe numbers that have been picked in the past are also more likely to be picked in the future (because of the weight of the paint on the balls, etc). Or some people believe that if a number hasn't been picked in the past, then it is 'due' to be picked soon.
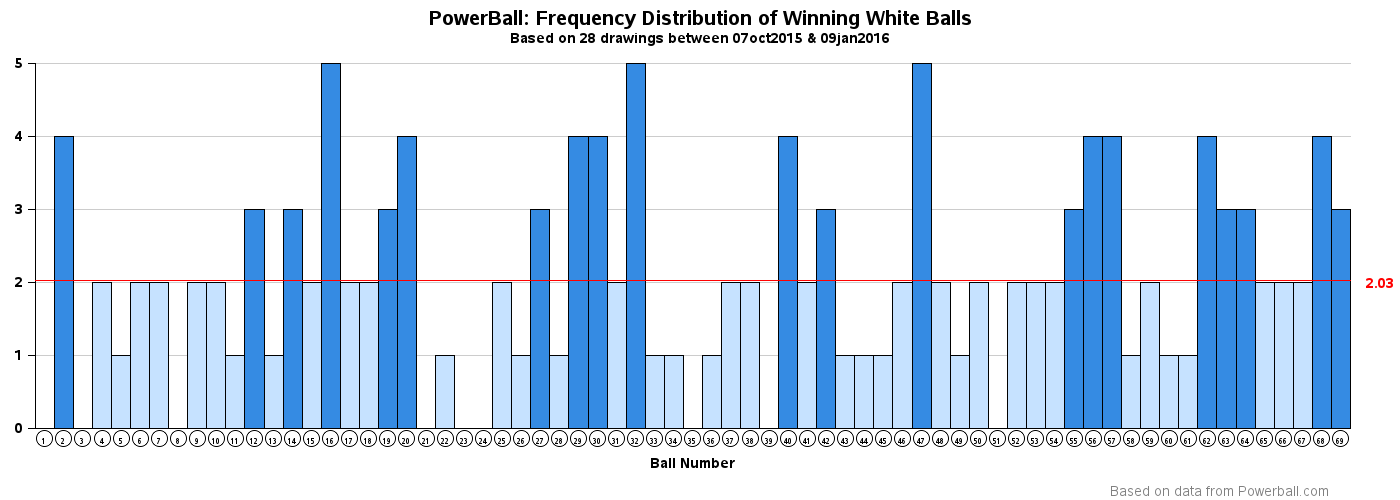
Need help picking lottery numbers? #analytics #powerball Click To TweetIn either of those latter two cases, here's a graph that might help you. It shows the number of times that each number has been picked, since it went to the 69 ball system on Oct 7, 2015 (we've had 28 lottery drawings since then). The red line is the average number of times a number has been picked, and if the number of times is above average, the bar is colored dark blue. The graph is a little wide for the blog format, but you can click the graph to see the full size version:What's your strategy for picking lottery numbers, and has it worked?!? :)




7 Comments
I did this many years ago using a spreadsheet and 5 years worth of history of a 5 number/ball local state lottery. I focused on the frequency of distribution for each ball. Interestingly enough I found there was a bell curve for each and in particular sort of a half bell curve for the first and last ball. Often I find picking the first and last ball number not hard but it was in between where it's the wild west with the full bell curves which are 3 remaining balls that are the challenge. I think using your application or an OLAP would make this more interesting since the historical data volume is huge and since I did this analysis over 20 years ago. The more data the better to see these patterns and adjust the predictions as you go visually.
Wow - some interesting news about picking lottery numbers! http://www.wral.com/lottery-insider-s-brother-arrested-in-jackpot-fixing-scandal/15624521/
Pretty sure this is a true statement:
Odds of winning by letting the system pick random numbers: 1 in 292,000,000
Odds of winning by selecting your own numbers: 1 in 292,000,000 (my wife was told this would actually improve her chances)
Odds of winning by not buying a ticket: 0 in 292,000,000
Actual winning numbers drawn: 4, 8, 18, 27, 34 and 10
using the chart and selecting only the numbers with 3 or more draws, the best you would have done is hit 19 and 27 (still better than I did :-/).
Can't even read my own number...only 27...19 was wishful thinking.
Thanks for this excellent summary, Galen! :)
Thanks. would the concept of permutation and combination be of any use in this case?
So great you published this especially since I'm in Texas and the current powerball is $1.3 billion. I bought a ticket yesterday (my first time ever) and sure could have used your charts. Might have to go back and get another one. Thanks for the fun analysis!