SAS 9.3 already has smooth (anti-aliased) lines in SAS/GRAPH device=png output, and in SAS 9.4 you will also get smooth lines in your device=gif output (and gif animations)! Woo-hoo!!!
Here are a couple of simple examples to demonstrate:
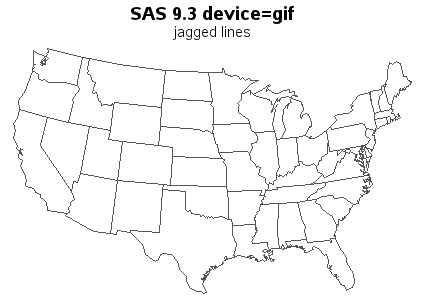
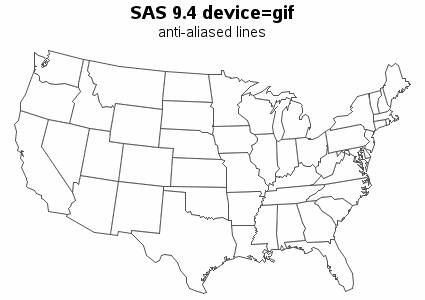
The first example is device=gif Proc Gmap output. If you look very closely, you'll notice that the borders of the states have a slight jagged/stair-step appearance in the 9.3 output, whereas the 9.4 output has smooth lines:
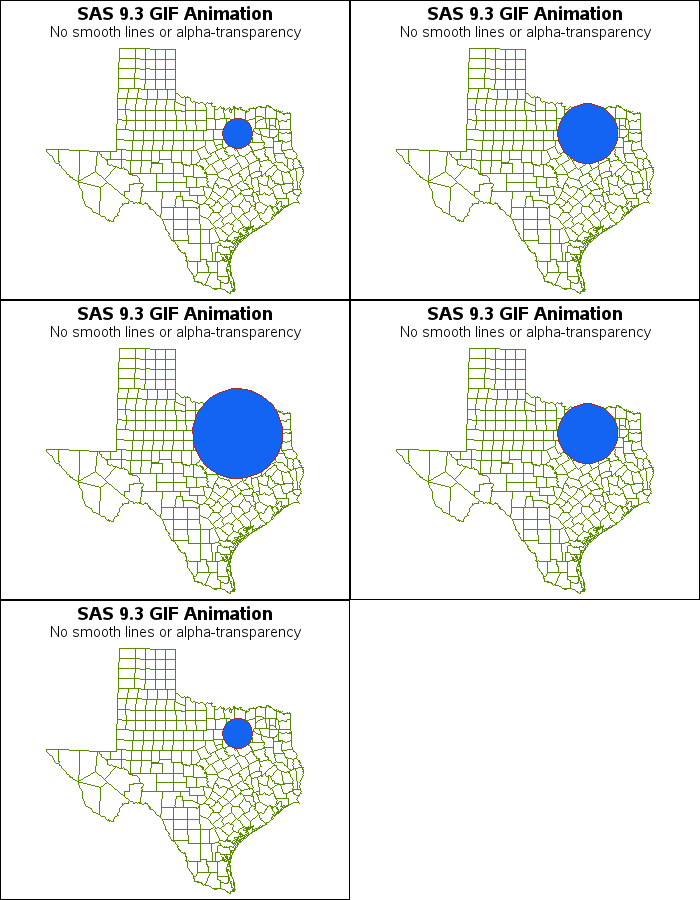
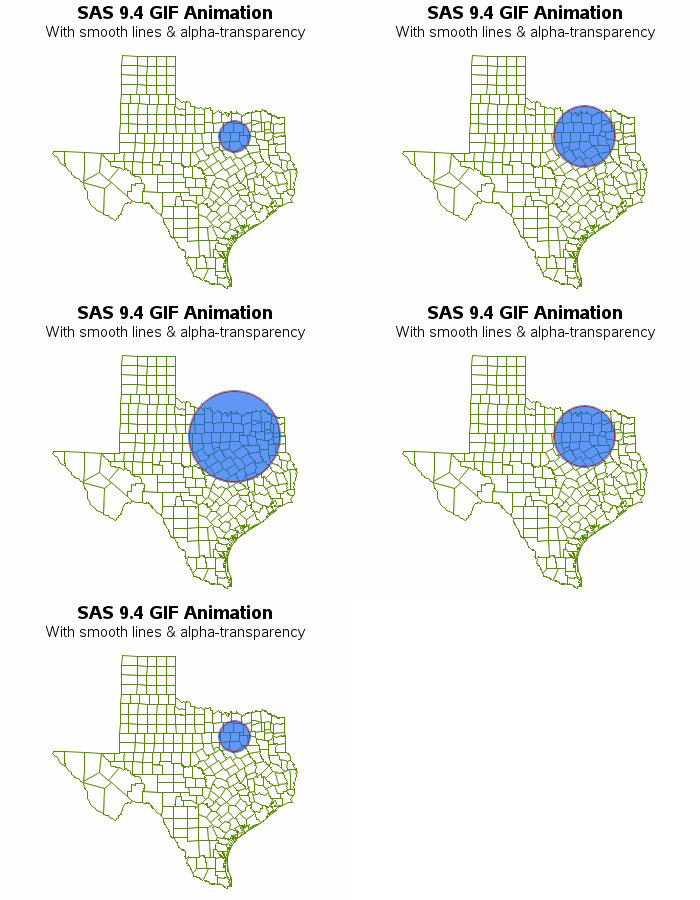
And even though you could get device=png smooth-line graphs in SAS 9.3, you could not use device=png for animations. And gif animations did not support smooth anti-aliased lines in SAS 9.3. Therefore it is great new functionality for SAS 9.4 gif animations to support smooth lines! See the difference in the examples below -- The 9.4 output has smooth lines in both the state borders and the circular marker:
And here's a link to a slightly fancier gif animation (originally written by Richard DeVenezia, and which I slightly modified to use the SAS 9.4 smooth lines) ... hope you enjoy!
Fancy SAS 9.4 smooth-line gif animation
Feel free to leave a comment describing how you might use this new SAS 9.4 feature!


8 Comments
To Author:
Is there any example of SAS code computing this USA map ?
Thank you !
Cindy Weng
Hi Cindy - you can get a copy of the code from the following samples page:
http://robslink.com/SAS/democd62/aaaindex.htm
Thanks for this demo.
So, am I correct in thinking that the only remaining advantage for PNG over GIF is the ability to use a huge number of distinct colors in a graph, whereas GIF remains limited to 256?
If so, I don't see that as a problem. It is exceedingly rare that a typical management or presentation graph would need a color palette even close to 256.
I just ran a test producing text slides with PROC GSLIDE. PNG files were about two or three times as large as GIF files for the same slides.
Hi LeRoy - I pretty much agree ... with the new 9.4 capabilities, I think gif is now preferable over png in most cases. There are only a few niche cases where I've ever needed more than 256 colors in a graph, and those were when I used a color photo as the background, and when I was creating a 3d cylinder graph, where the sides of the cylinder had smooth/gradient shading. Also, I think more people know/recognize what a gif file is, rather than a png file, and some older tools (such as 'xv' image viewer on an old HP Unix system I occasionally use) can display a gif but not a png file.
I'll probably continue to use device=png in most of my examples, so they will produce nice-looking output for users that are running pre-9.4 SAS ... but if I were writing sas/graph programs just for my own personal use, I'd probably go with device=gif :)
Pingback: Top 4 reasons to upgrade to SAS 9.4 | The SAS Training Post
Maybe SAS will also put effort into improving for lack of modern design in their applications such as Enterprise Guide, Enterprise Miner and Forecast Studio which all look like applications developed for Windows 95. Anti-aliasing has been around for a long time.
SAS always likes to hear customer feedback! :)
Perhaps it would be good to post some suggestions to the specific SAS application community pages - for example, here is the one for Enterprise Guide... https://communities.sas.com/community/support-communities/sas_enterprise_guide