Traffic services, more specifically, unsafe driving, impact people every single day. According to the National Highway Traffic Safety Administration, nearly 43,000 people died in U.S. traffic crashes in 2021, the highest number in 16 years, with deaths due to speeding and impaired or distracted driving on the rise. Pedestrian fatalities rose 13 percent.
Each day about 28 people in America die in drunk-driving car crashes. That makes up approximately one-third of all car crash fatalities in the U.S. In Canada, that number is four daily fatalities with an estimated 175 daily injuries.
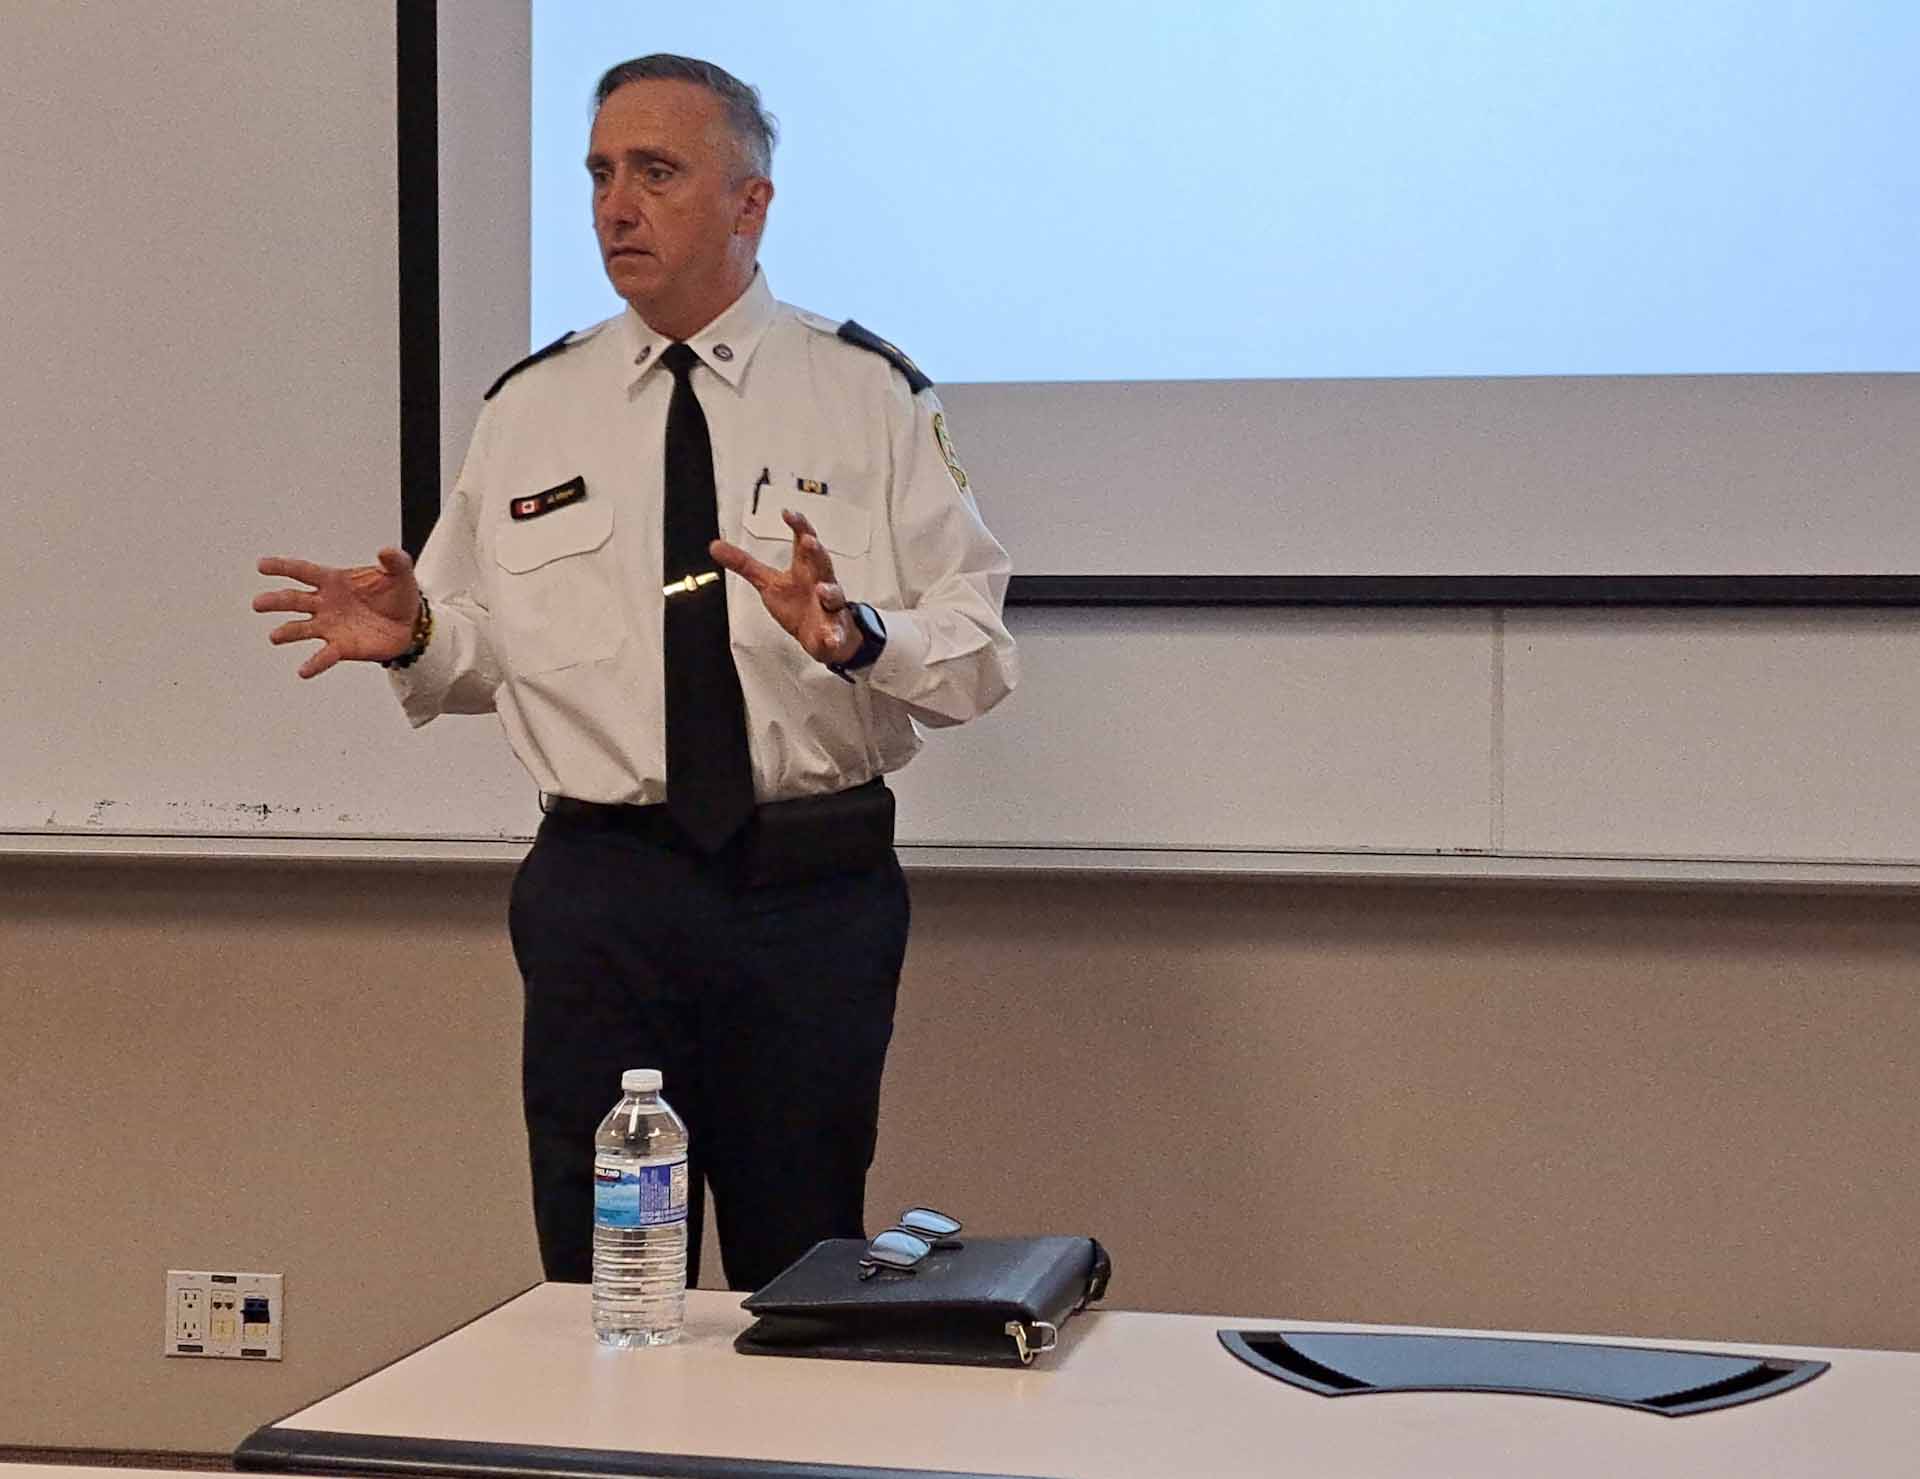
However, most people aren't thinking much about traffic services, according to Matt Moyer, Superintendent of Traffic Services at the Toronto Police Service.
"People aren't waking up and thinking to themselves, 'I wonder what traffic services is up to?' But it's nice when people in the community adopt our traffic safety philosophy because we need that fresh lens and perspective," Supt. Moyer recently told a room full of college students sharing their latest traffic safety research.
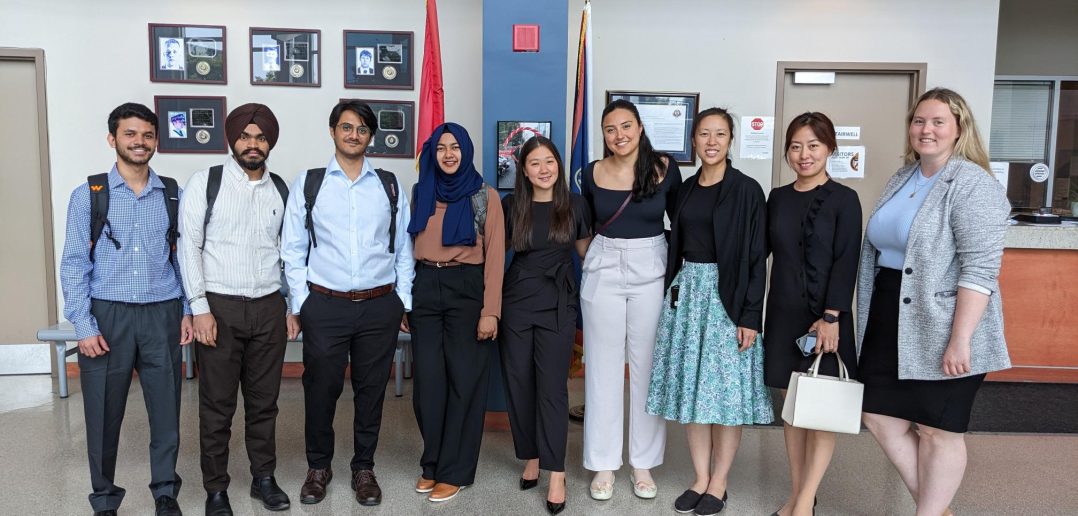
Those students were the latest participants of the SAS Safe Roads Competition, an annual contest entering its fifth year. It allows university and college students to boost their data analytics skills by analyzing KSI (killed or seriously injured) incident report data from Toronto Police Services and aggregated Geotab fleet telematics showing traffic speeds, road conditions, and more to derive insights and help improve road safety.
"We embrace the Vision Zero concept," said Supt. Moyer, referring to a municipal campaign to eliminate traffic-related deaths and serious injuries. "Because it's not about reducing; it's about eliminating. Zero is the number we're looking for. To think there are students out there that think about this stuff the way we do, it's incredibly impressive."

Data is a language everyone understands
This year, there was an added focus on daylight savings time's impact on KSI collisions. The winning team of this year's competition, Humber College, alongside runner-up Centennial College, reached the same conclusion: light and road surface conditions, among others, are more influential on KSI collisions than the change in daylight savings time alone. Humber's linear regression equation - a straight line that helps visualize and predict how one variable changes with respect to another - factored in road surface and light conditions to reach this conclusion.
But the traffic analysis didn't stop there. Traffic safety officers received additional information from both teams, such as the intersections where fatal collisions are most likely to occur, the chances of a fatality occurring in a collision based on factors like speed and the type of vehicle involved, and even policy and infrastructure recommendations.
Officers asked questions and wanted to see more: when exactly are accidents most likely to occur during rush hour periods? What age groups are most likely to be involved in fatal collisions? Toronto Police Services Senior Analyst Daphne Choi explained how students worked with a limited data set. Still, she emphasized that much of the information presented reinforces existing strategies and, in some cases, lays the groundwork for future policy development.
Supt. Moyer was confident that the public would benefit greatly from seeing the data presented that day. "What you've managed to do is deliver information to us in a way where you're not talking under us or over us, you're talking to us," he said, reinforcing the importance of education among the general public when it comes to traffic safety. "If you gave that presentation to 10 people who were charged with impaired driving, that would be hugely impactful. This type of information and analysis would help them understand their mistakes and what good decisions look like."

