At the end of March, the German government sponsored a hackathon called #WirVsVirus. The aim was to bring Germany’s collective coding expertise to bear on some of the many problems surrounding COVID-19. In total, more than 27,000 coders joined the challenge, working from home, and programming for 48 hours from March 20 - 22. Data was made publicly available, from hospitals, institutions and other bodies.
Given the widespread, devastating effects of COVID-19, there were plenty of challenges available for the coders to examine. From supply and demand in supermarkets to the role of medical professionals and how to reintegrate people who have recovered from the infection and much more. In looking at the data made public from the hackathon, there were over 1100 submissions which included a textual description (in German and English). Manual review of such data could produce qualitative results, potentially creating bias. How can we surface the results of what folks have been working on in a quantitative and visual way? This is where text analytics and subsequent visualization comes in.
Visualizing results
I have done an initial analysis of the German hackathon submissions using SAS capabilities in text analytics and visualization. I used SAS Visual Text Analytics to assess topics and themes across submissions, then explored the concepts in more depth to create a concept taxonomy of relevant terminology. These were made available for further exploration in an interactive dashboard environment, SAS Visual Analytics. My aim was to create a way to visualize all the benefits of the German hackathon, and to make the results easily accessible for anyone interested — and not just analytics experts. You can see an example of the results in the screenshot below.
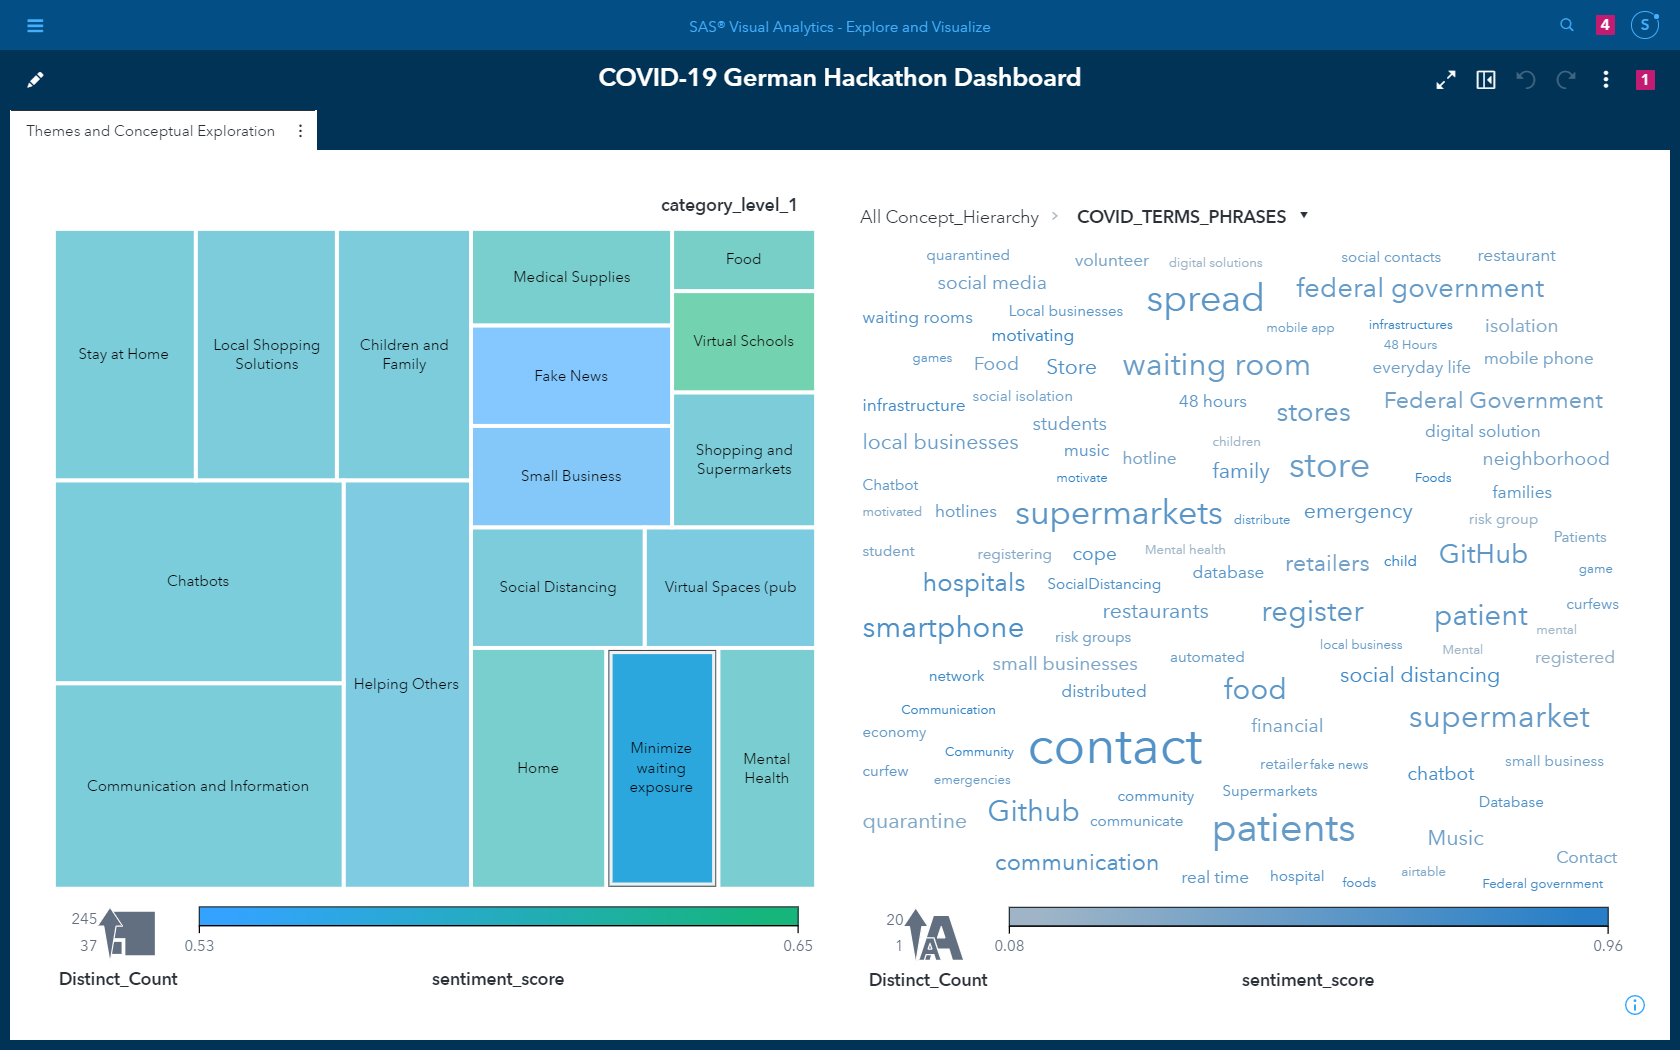
On the left-hand side of the screenshot is a treemap. These diagrams show data as rectangles, where the size and color of the rectangles show different metrics or measurements. In this case, the phrases in the diagram highlight themes across the different hackathon submissions. The size of the box shows the number of submissions related to that theme, and the color shows general sentiment expressed in the submissions. Blue is neutral and green shows positive sentiments.
There were a number of important themes, including:
- Providing virtual schools and learning environments.
- Disseminating up-to-date information through chatbots and communication.
- Technology and other tools that may be useful in helping others through the crisis.
- Promotion of virtual spaces, particularly a virtual bar and pub environment.
There were also 111 submissions which touched on minimizing exposure while waiting for services. This has been a subject of exploration in both media and research. As a user of the dashboard, in the image below, I leverage the extracted concepts to explore this theme in more detail.
The dashboard enables interactive exploration on any of these themes, such as “minimizing exposure.” When a theme is selected in the treemap to the left, a set of relevant concepts is displayed in the word cloud to the right. Word clouds usually show the frequency of terms in the dataset, minus a stop list - words that are filtered out for search purposes. However, this one is a bit different. It was curated using SAS Visual Text Analytics, through graphically driven analysis methods that identified and selected terminology that is most relevant to a problem. The environment also enables subject matter experts to refine this terminology. In this case, therefore, the word cloud highlights submissions about minimizing contact in supermarkets, local businesses, stores and waiting rooms in hospitals. These are also color coded by relative sentiment.
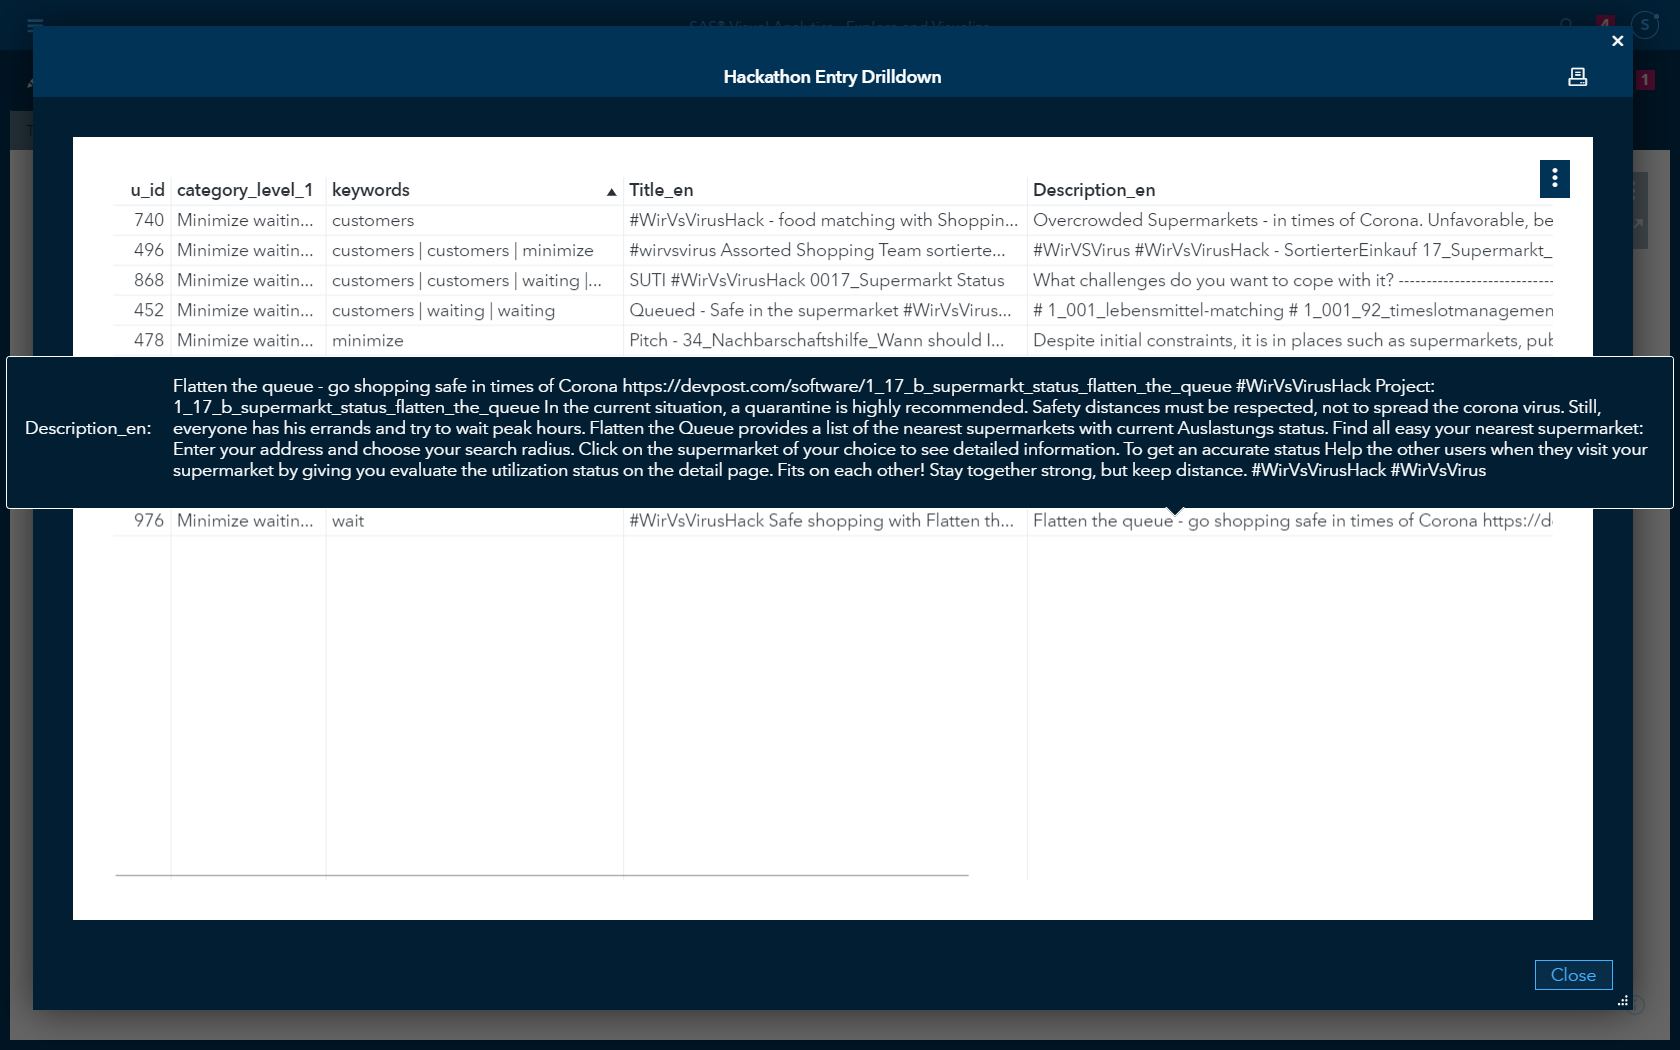
This information can all be seen directly from the dashboard. It's also possible to drill down into the relevant submissions through selected topics and concepts, and link to the videos each team created. For example, this is a screenshot of the drilling-down to find out how to minimize waiting times in supermarkets.
This process shows at a glance how text analytics can quickly get to the root of the creativity offered by the hackathon — and also how it can highlight the issues in a quantitative way. Similar methods can be applied to other COVID-19 related datasets, including research data to help answer some of the most relevant problems related to virus mutation, incubation, and transmission. The process has also highlighted many of the biggest pain-points caused by COVID-19, and especially those that need to be addressed to prevent further spread of the virus.
To learn more, read how AI can help reveal answers in 36,000 text documents about coronavirus and visit the SAS COVID-19 Data Analytics Resource Hub.

1 Comment
Great analysis, clearly formulated and comprehensive in its scope. Gives an overall view of the problem.