“Ocean acidification is sometimes referred to as global warming's equally evil twin.” ~ Elizabeth Kolbert
This is the second post in my two-part series about climate change. You can read part 1 of this series here.
When engaging in data exploration for insights, it’s good practice to start with a hypothesis, rather than just jumping in with both feet. For example, if your goal is to uncover insights into your manufacturing process, don’t just grab all the manufacturing related data and start slicing and dicing. Instead, investigate a specific hypothesis, something like whether or not yields are impacted by supplier / raw material sources. But cast your net wide – seek out data likely to confirm or refute the hypothesis. Perhaps you’ll confirm your initial suspicion, or find no connections, or find that rather than raw material sources, the biggest contributor to poor yields is operator training. In any case, such a targeted approach is much more likely to bear fruit than an ill-formed plan to simply interrogate all the data all at once.
With this in mind, I began my data-driven investigation into climate change with a hypothesis about how global warming might be impacting the frequency and strength of hurricanes – perhaps the most significant impact of climate change that will affect me living here in North Carolina.

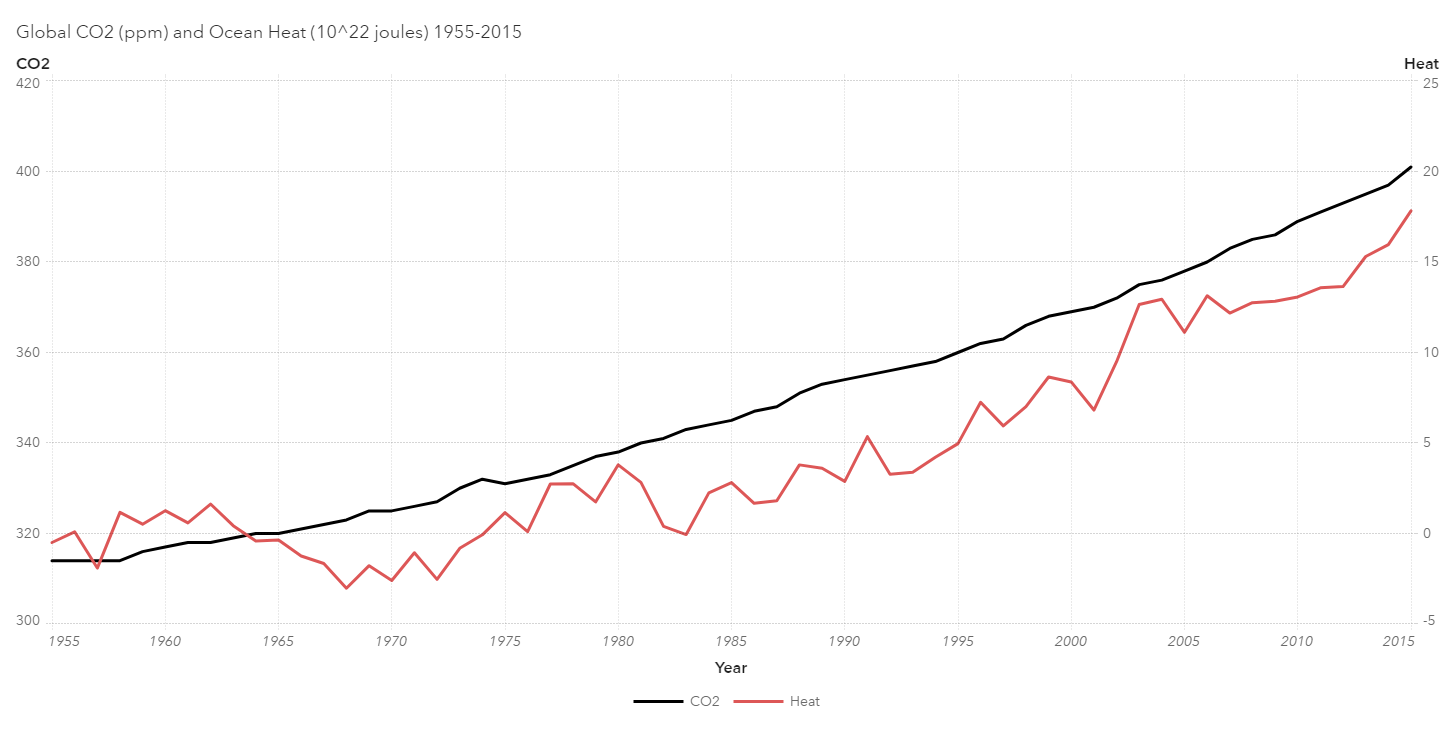
A full 90% of the excess energy trapped by greenhouse gasses is not stored in the atmosphere but in the oceans, which has a much greater specific heat capacity than the atmosphere. Consider sticking your hand briefly in either a 400-degree oven or in boiling water. Congratulations if you chose the oven. It may be hotter than the water, but the less dense air with its lower specific heat contains much less energy than boiling water 200 degrees cooler. Your hand knows the difference between energy/heat and temperature.
What, if anything, is going to be the impact of all this stored energy? There are several hurricane-related outcomes to be considered: more frequent hurricanes, more powerful storms, both or neither. My initial inclination was towards more powerful cyclones. Storms that originate in the Atlantic Ocean are typically triggered by low pressure waves moving off the west coast of Africa, and without a causal effect which would change the frequency of these waves, the frequency of hurricanes should be expected to remain unchanged. This should be easy to investigate, and with access to the Climate Change Indicator datasets provided by the U.S. EPA, it was.

From the table above, note that the correlation coefficients between CO2 concentrations and cyclones are all positive but not terribly strong. My original hypothesis, that we should be seeing more powerful storms (major hurricanes), has the least support, with a coefficient of 0.21. On the other end of the spectrum, Named Storms, including hurricanes and tropical storms, has a coefficient of 0.46, a solidly moderate score. If you were to draw any tentative conclusions from the analysis, it might be that the latent heat energy stored in the increasingly warming ocean is supplying enough energy to passing low pressure systems from Africa to enable more of them to develop from mere tropical depressions into full-fledged tropical storms, and with something similar happening in the Gulf and the Caribbean as well. Statistically significant, but not alarmist.
Understanding acidity data
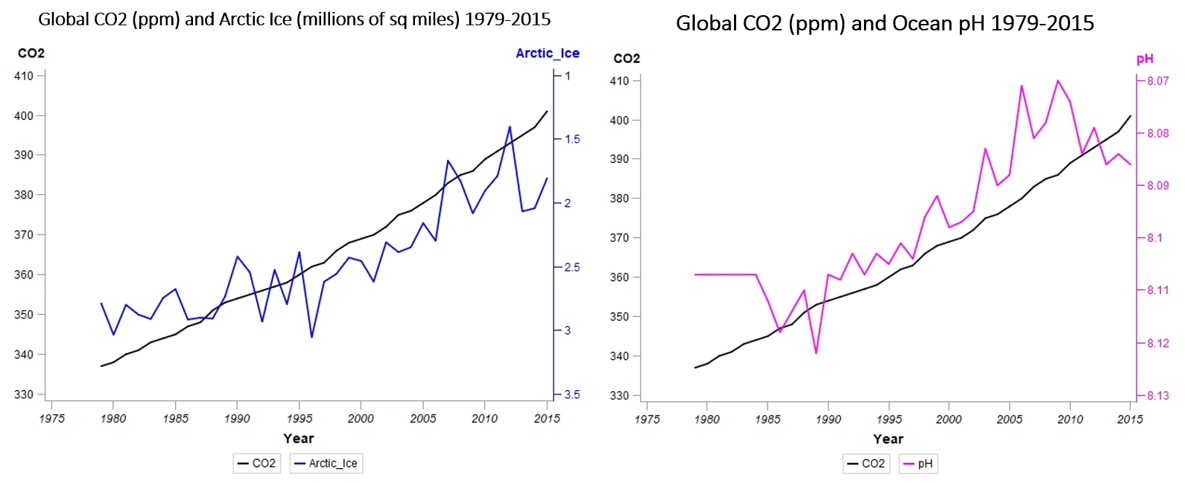
Before we move from heat to our next topic, acidity, let’s take a quick look at the Arctic ice data. With a correlation coefficient of -0.88, the loss of Arctic sea ice is strongly related to CO2 concentrations, further illustrated by the accompanying graph (below, left), with the right-hand Y-axis inverted to show ice coverage shrinking from the bottom towards the top. Arctic ice coverage is rapidly approaching levels half that of only 30 years ago – it’s not a good time to be a polar bear.
 As my hypothesis involved ocean temperatures, heat and storms, I gathered together the other ocean-related data that was available, including the aforementioned Arctic ice, as well as pH levels (above, right) measuring ocean acidity. Like you, I’ve heard about ocean acidification, where the ocean dissolves increasing amounts of atmospheric CO2 (an estimated 30–50% of the carbon dioxide generated by human activity), but it was just another data point in a sometimes overwhelming sea of information (pun intended) about climate change, along with rising sea levels, escalating wildfires and encroaching desertification.
As with the CO2/temperature data, manipulating acidity data with your own hands lets you take in the significance in a way a headline from a news article doesn’t. In short – this one did raise alarm bells.
You can see the right-hand, Y-axis has been inverted to show decreasing pH as you move up the scale. Lower pH numbers indicate increasing acidity (an increasing H+ ion concentration). A pH of 7.0 is neutral, 1.0 is a strong acid, and 14.0 is a strong base. Furthermore, the scale is logarithmic – the difference between pH’s of 6 and 5 indicate a 10-fold change in hydrogen ion concentration. As those numbers continue to decrease, with a -0.96 correlation with CO2 concentrations, there is danger lurking around the 7.8 to 7.6 range.
In particular, ocean acidity matters to all marine creatures who make their shells or skeletons from calcium carbonate, their major mineral building block. The list includes corals, mollusks, echinoderms, calcareous algae and other shelled organisms. As ocean acidity increases, available carbonate ions decrease, removing more and more of what these creatures need to build their shells and skeletons. It’s like trying to build a house while someone keeps stealing your bricks.
Since the beginning of the Industrial Revolution, the pH of surface ocean waters has fallen by 0.1 pH units, from about 8.2 to 8.1. Since the pH scale is logarithmic, this change represents approximately a 30 percent increase in acidity. By the end of this century, if current emission trends continue, it could fall by another 0.3 units, thereby increasing the acidity of the oceans by almost 2.5 times. In the last 300 million years, ocean pH has never fallen to more than 0.6 units below pre-industrial levels.

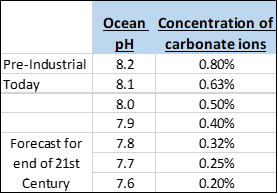
The chart to the left shows what happens to the concentration of carbonate ions as pH levels become more acidic. By the end of this century, if the pH hits 7.6, carbonate ion concentrations could fall to 0.20%, one-fourth of what it was in the pre-industrial ocean. Somewhere along this continuum (0.5%, 0.4%, 0.3%, 0.2%), although we don’t know precisely where, marine life will be irreparably harmed.
How marine life affects extinction
The largest mass extinction in Earth’s history, the Permian-Triassic extinction event 252 million years ago, wiped out 95% of all marine species. The most likely mechanism was the release of CO2 by the Siberian Traps flood basalts and the resulting acidification of the oceans. The same situation also likely occurred at the end of the Cretaceous period, when the Chicxulub asteroid had the same effect on ocean acidity, killing off the dinosaurs with a nuclear winter event, and 75% of marine life via acid rain.
These species form the base of the food chain in marine ecosystems, and when they go so do all the animals which feed on them. Furthermore, all marine organisms are affected, not just those with shells. Changes in carbon dioxide changes the internal chemistry of tissues and cells. Different species have different capacities to maintain their acid-base balance or adjust to a new pH. Maintaining that balance requires energy, diverting resources from growth, reproduction, and immune function, with potential long-term consequences for the survival of some of those species.
Rising sea levels will create hundreds of millions of climate refugees from Bangladesh to Miami, but sea level changes will not be an extinction event. Even if all the continental ice on Greenland and Antarctica were to melt, raising sea levels by 200 feet, we and most of the planet would manage to survive.
Losing our marine ecosystems to ocean acidification, however, is a more deadly threat.
To paleontologists of the future, of whatever species, the 300-year gap between the distinctive radioactive layer created by above-ground nuclear tests in the 1950s, and a possible carbon-driven CO2/ocean acidity extinction event in the 22nd or 23rd century will be imperceptible. They will likely come to believe we died off in a planet-wide nuclear war, when the truth was so much more mundane and preventable. It is still preventable, and represents the greatest opportunity humanity has ever had to collaborate on a global scale.
Learn more about hurricane frequency in this data story from GatherIQ