English

Chris Hemedinger 0
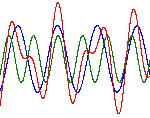
Mathematical squiggles in SAS

John D. Cook shared a picture of "pretty squiggles" on his blog, as well as a prose description of the mathematics behind it. I'm more of a programmer than a mathematician, but I've attempted to transcribe his description into a SAS program. I used DATA step to generate the point

Data Visualization
Sanjay Matange 0
GTL Layouts

The Graph Template Language (GTL) provides you the ability to create complex graphical layouts. We have seen how to create a regular grid of cells based on one or more classification variables using the SGPANEL procedure.   Each cell contains the same type of plot.  This topic was covered in Dan's article on

Learn SAS
Jim Simon 0
Time to trade in your jalopy macro?

Suppose you have an old jalopy that's perfectly reliable.  Your jalopy gets you where you wanna go: no frills; no drama. Do you trade your old wheels in for a racecar that accelerates like crazy and corners like it's on rails? Or stick with what's old and comfortable?   Your choice