How to coerce SAS/IML vectors to matrices

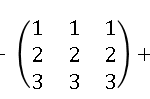
Recently a SAS/IML programmer asked a question regarding how to perform matrix arithmetic when some of the data are in vectors and other are in matrices. The programmer wanted to add the following matrices: The problem was that the numbers in the first two matrices were stored in vectors. The