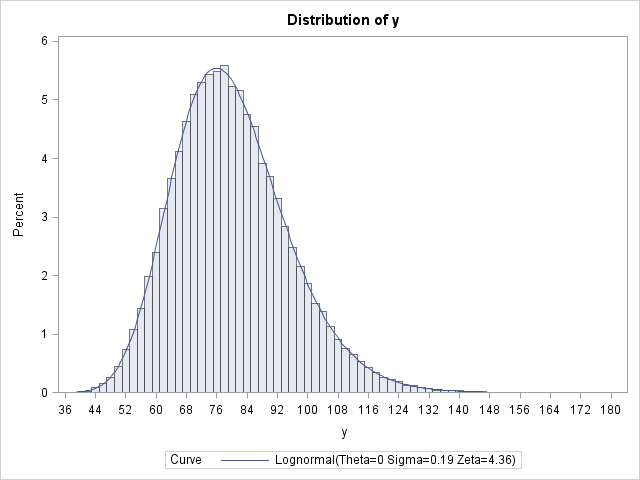
English

Data Visualization
Sanjay Matange 0
Multi-Group Series Plots

The series plot is a popular way to visualize response data over a continuous axis like date with a group variable like treatment.   Here is some data I made up of a response value by date, treatment, classification and company that makes the drug.  The data is simulated as shown in the attached program

Michael Smith 0
What not to miss at PharmaSUG 2014

This year’s conference moves to San Diego, and it’s packed with great learning, networking and fun things to do. I’ve had a small part in the planning, but the bulk of the work is being done by a very hard-working group of volunteers.  If you want to be a part of