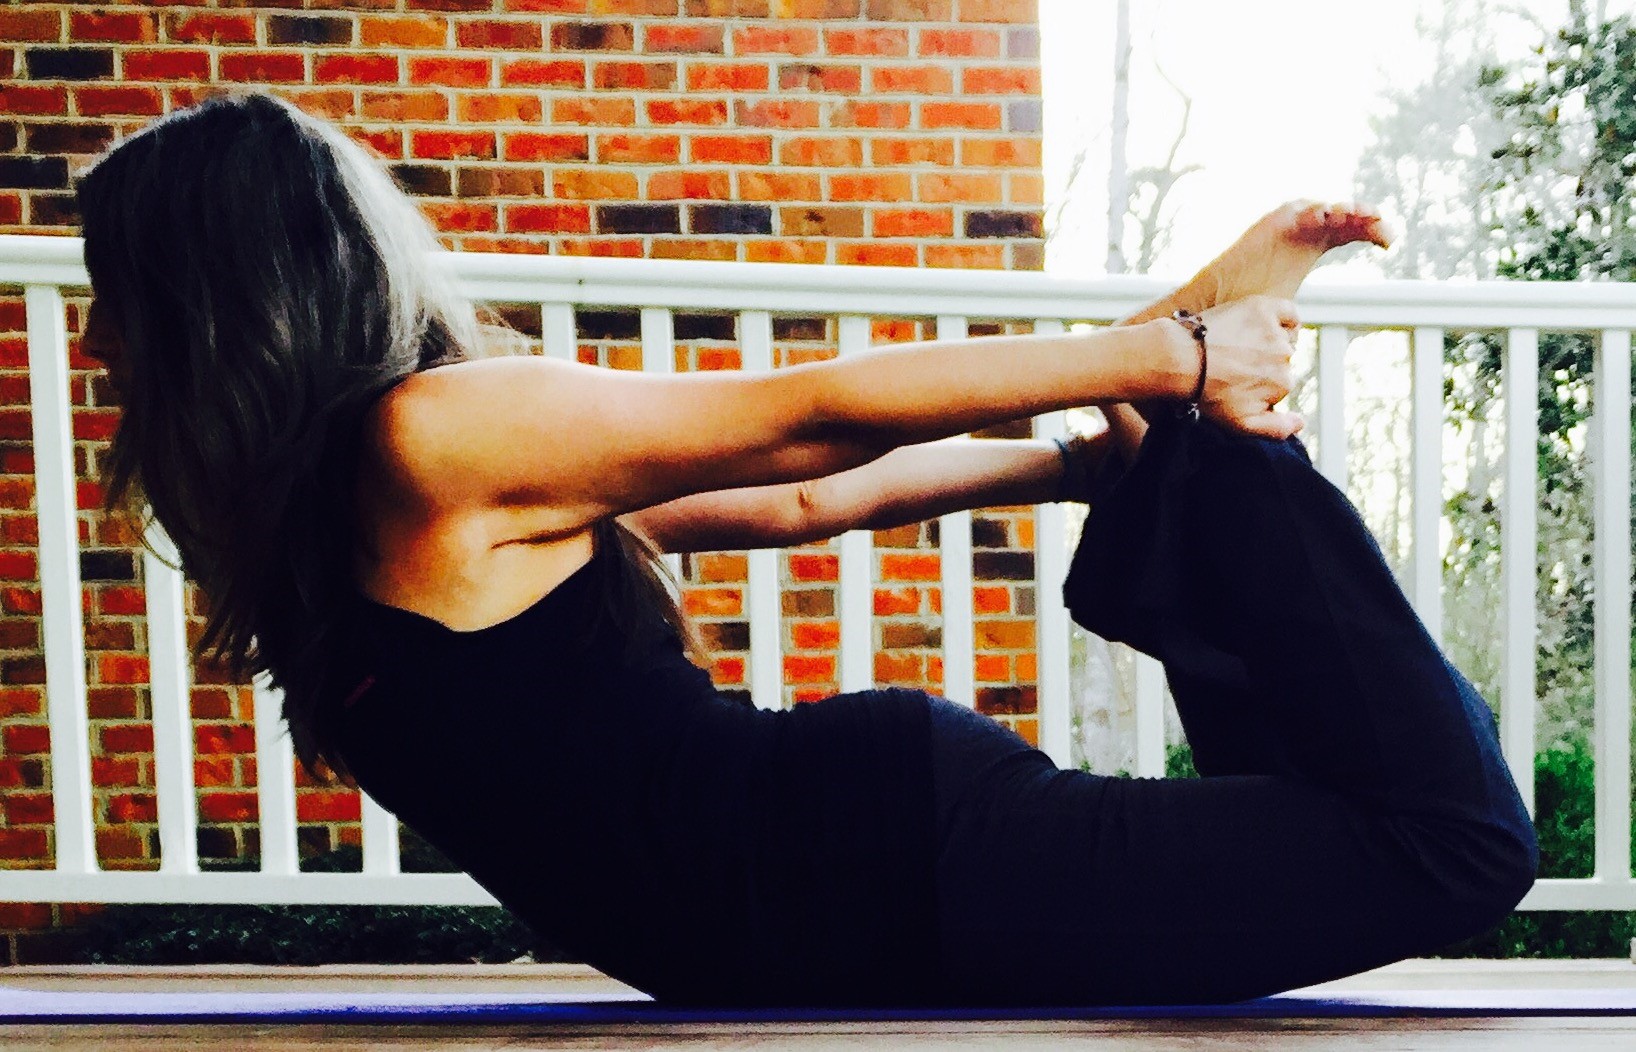
English

Data Visualization
Sanjay Matange 0
Likert Graph Revisited

A few weeks back I posted an article on ways to create a WindRose Graph using SGPLOT procedure.  The process is relatively simple.  Create (R, Theta) data with both numeric axes where the Theta is a value in the data range is 0-360, and R is the corresponding response value.  Then

Learn SAS
Samantha Rowland 0
How can I learn SAS?

What would come to mind if you were told that you have to attend a SAS training course? Perhaps, you have a vision of an instructor sitting at the front of a classroom, endlessly reading PowerPoint slides verbatim in a monotonous voice while you sit there baffled, wondering what is