
The next data governance challenge: Agility

.@philsimon says that data-governance professionals will need to be more agile than ever.
.@philsimon says that data-governance professionals will need to be more agile than ever.
SAS Enterprise Guide has come a long way since version 1.0 was released in 1999! Are any of you original users that remember the Help characters, Clippy, Peedy or Merlin? I was working as a statistician for another company that year, and I attended a SAS user group meeting where
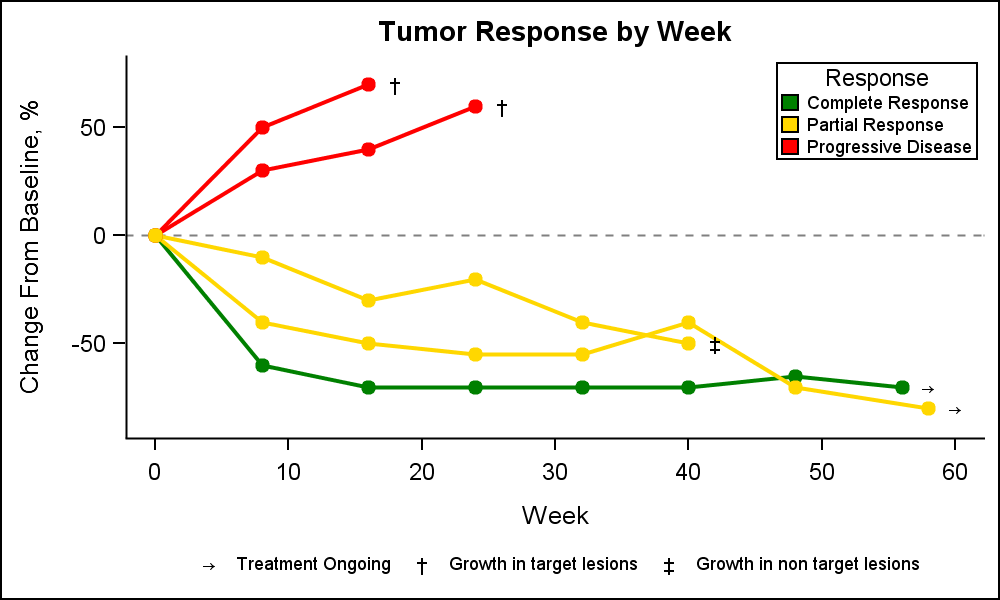
A Spider Plot is another way of presenting the Change from Baseline for tumors for each subject in a study by week. The plot can be classified by response and stage. Another way of displaying Tumor Response data was discussed earlier in the article on Swimmer Plot. This article is prompted

