
Understand the data for omnichannel

Once you have a data strategy for omnichannel, what's next? Kim Kaluba explains.
Once you have a data strategy for omnichannel, what's next? Kim Kaluba explains.
SAS Visual Investigator has an attractive user interface. One of its most engaging features is the network diagram, which represents related ‘entities’ and the connections between them, allowing an investigator to see and explore relationships in their source data. For maximum impact, each entity in the network diagram should have an
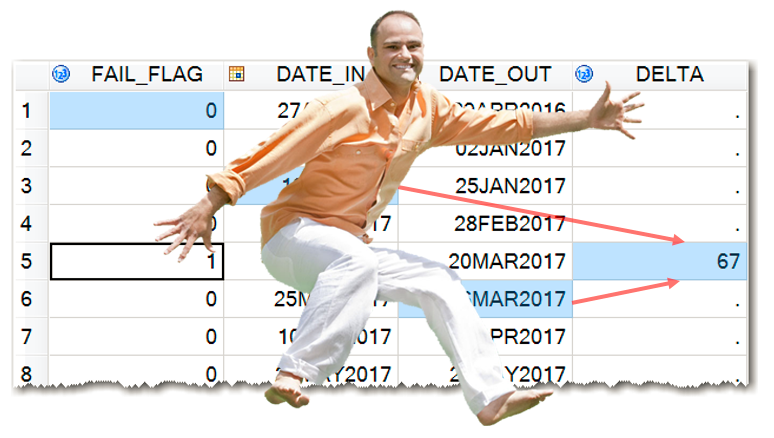
The purpose of this blog post is to demonstrate a SAS coding technique that allows for calculations with multiple variables and multiple observations across a SAS dataset. This technique can be useful for working with time series, clinical trials, - in any data step calculations involving values from different observations.

