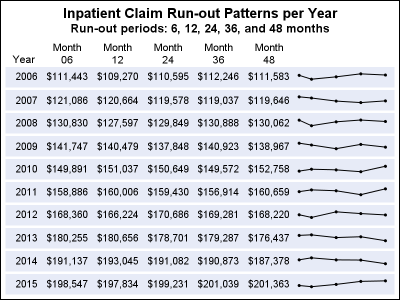
English

Data Visualization | Learn SAS | Programming Tips
Sanjay Matange 0
Spark table

In the previous post, I discussed creating a 2D grid of spark lines by Year and Claim Type.  This graph was presented in the SESUG conference held last week on SAS campus in the paper ""Methods for creating Sparklines using SAS" by Rick Andrews.  This grid of sparklines was actually the

Analytics | Fraud & Security Intelligence
Veena Hirannaiah 0
Combat wire fraud with analytics

As the banking industry continues to combat increasing fraud challenges, payment fraud is growing exponentially. This growth stems from a shifting payment landscape with new and varied payment options. Globally, governments are introducing new initiatives like faster payments and real-time payments which compress turnaround times. These initiatives are altering the