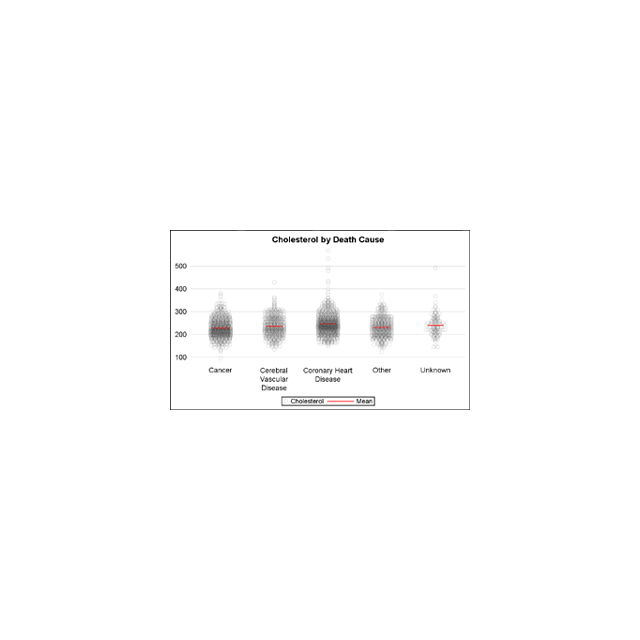
Insurance

Data Visualization
Sanjay Matange 0
Getting Started with SGPLOT - Part 4 - Series Plot

This is the 4th installment of the Getting Started series.  The audience is the user who is new to the SG Procedures.  Experienced users may also find some useful nuggets of information here. Series plots are frequently used to visualize a numeric response on the y-axis by another numeric variable on

Analytics | Customer Intelligence
Steffen Stahl 0
Customer Intelligence Forum 2017 - Gespräch mit Dr. Jörg Reinnarth, Geschäftsführer des SAS Partners Cintellic

Am 14. März findet in Frankfurt in der „Klassikstadt“ das Customer Intelligence Forum 2017 statt. Ich habe vorab Dr. Jörg Reinnarth, den Geschäftsführer vom SAS Partner Cintellic, gefragt, welche Rolle seiner Meinung nach Analytics in Sachen Marketingmaßnahmen & Co. in Zukunft spielen wird. Er sieht vor allem einen Kulturwandel auf

1 102 103 104 105 106 113