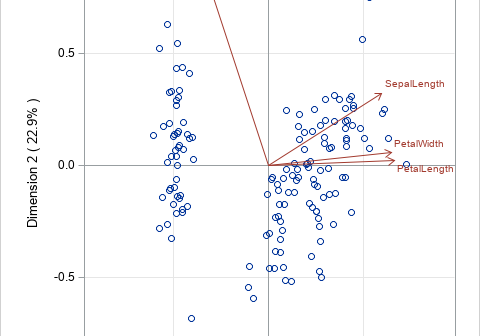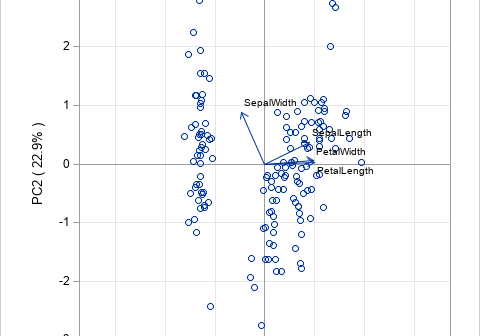
Biplots are two-dimensional plots that help to visualize relationships in high dimensional data. A previous article discusses how to interpret biplots for continuous variables. The biplot projects observations and variables onto the span of the first two principal components. The observations are plotted as markers; the variables are plotted as
Tag: Matrix Computations
Principal component analysis (PCA) is an important tool for understanding relationships in continuous multivariate data. When the first two principal components (PCs) explain a significant portion of the variance in the data, you can visualize the data by projecting the observations onto the span of the first two PCs. In
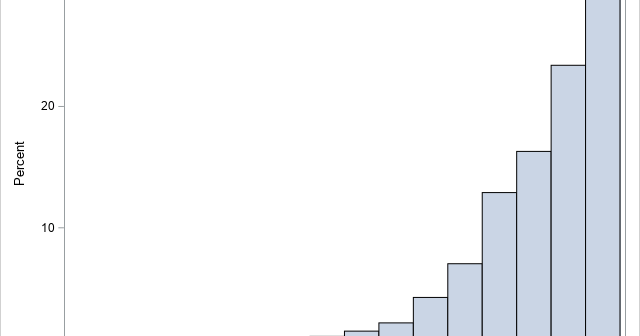
In response to a recent article about how to compute the cosine similarity of observations, a reader asked whether it is practical (or even possible) to perform these types of computations on data sets that have many thousands of observations. The problem is that the cosine similarity matrix is an
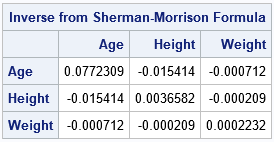
For linear regression models, there is a class of statistics that I call deletion diagnostics or leave-one-out statistics. These observation-wise statistics address the question, "If I delete the i_th observation and refit the model, what happens to the statistics for the model?" For example: The PRESS statistic is similar to
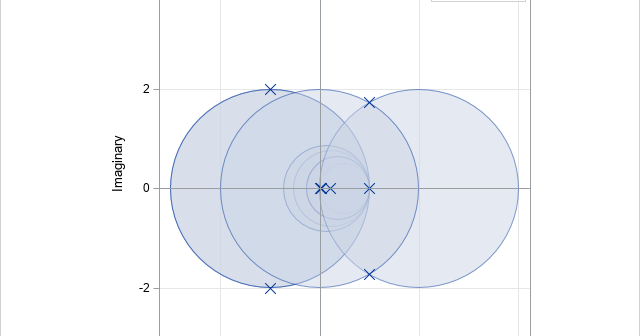
The eigenvalues of a matrix are not easy to compute. It is remarkable, therefore, that with relatively simple mental arithmetic, you can obtain bounds for the eigenvalues of a matrix of any size. The bounds are provided by using a marvelous mathematical result known as Gershgorin's Disc Theorem. For certain
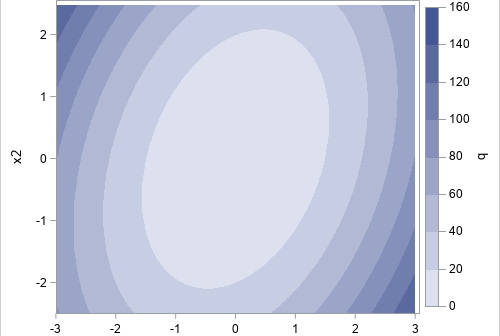
A quadratic form is a second-degree polynomial that does not have any linear or constant terms. For multivariate polynomials, you can quickly evaluate a quadratic form by using the matrix expression x` A x This computation is straightforward in a matrix language such as SAS/IML. However, some computations in statistics
In numerical linear algebra, there are often multiple ways to solve a problem, and each way is useful in various contexts. In fact, one of the challenges in matrix computations is choosing from among different algorithms, which often vary in their use of memory, data access, and speed. This article
In simulation studies, sometimes you need to simulate outliers. For example, in a simulation study of regression techniques, you might want to generate outliers in the explanatory variables to see how the technique handles high-leverage points. This article shows how to generate outliers in multivariate normal data that are a
I remember the first time I used PROC GLM in SAS to include a classification effect in a regression model. I thought I had done something wrong because the parameter estimates table was followed by a scary-looking note: Note: The X'X matrix has been found to be singular, and a
A data analyst asked how to compute parameter estimates in a linear regression model when the underlying data matrix is rank deficient. This situation can occur if one of the variables in the regression is a linear combination of other variables. It also occurs when you use the GLM parameterization