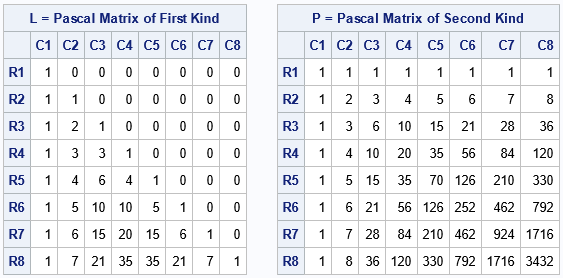
Look at the following matrices. Do you notice anything that these matrices have in common? If you noticed that the rows of each matrix are arithmetic progressions, good for you. For each row, there is a constant difference (also called the "increment") between adjacent elements. For these examples: In the
Tag: Matrix Computations
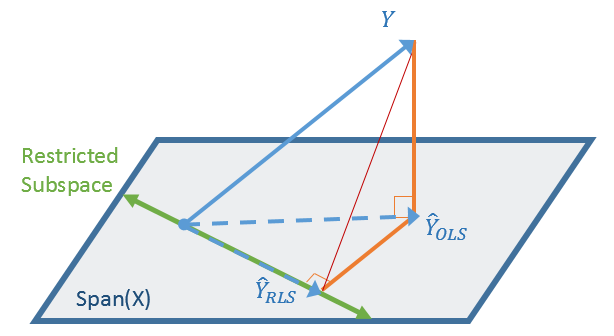
A data analyst recently asked a question about restricted least square regression in SAS. Recall that a restricted regression puts linear constraints on the coefficients in the model. Examples include forcing a coefficient to be 1 or forcing two coefficients to equal each other. Each of these problems can be
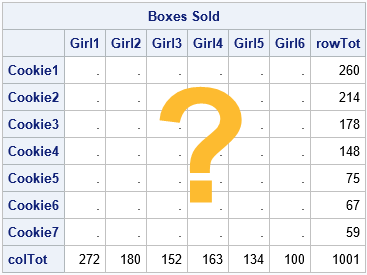
Matrix balancing is an interesting problem that has a long history. Matrix balancing refers to adjusting the cells of a frequency table to match known values of the row and column sums. One of the early algorithms for matrix balancing is known as the RAS algorithm, but it is also
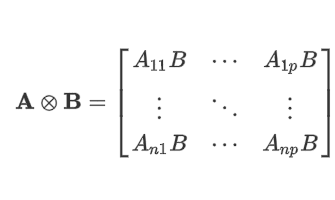
The Kronecker product (also called the direct product) is a binary operation that combines two matrices to form a new matrix. The Kronecker product appears in textbooks about the design of experiments and multivariate statistics. The Kronecker product seems intimidating at first, but often one of the matrices in the
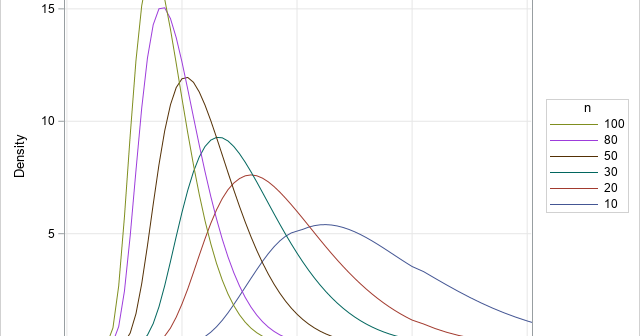
If you have ever run a Kolmogorov-Smirnov test for normality, you have encountered the Kolmogorov D statistic. The Kolmogorov D statistic is used to assess whether a random sample was drawn from a specified distribution. Although it is frequently used to test for normality, the statistic is "distribution free" in
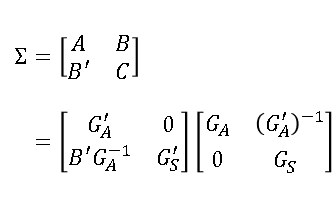
Sometimes in matrix computations, it is important to display the nonzero elements of a matrix. This can be useful for visualizing the structure of a sparse matrix (one that has many zeros) and it is also useful when describing a matrix algorithm (such as Gaussian elimination) that introduces zeros at
Rockin' around the Christmas tree At the Christmas party hop. – Brenda Lee Last Christmas, I saw a fun blog post that used optimization methods to de-noise an image of a Christmas tree. Although there are specialized algorithms that remove random noise from an image, I am not going to
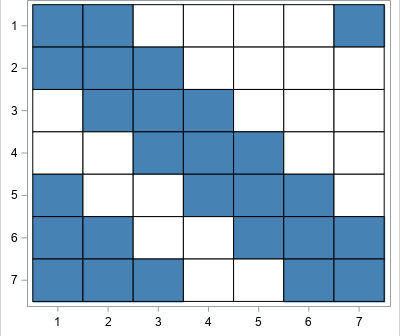
Binary matrices are used for many purposes. I have previously written about how to use binary matrices to visualize missing values in a data matrix. They are also used to indicate the co-occurrence of two events. In ecology, binary matrices are used to indicate which species of an animal are
This article discusses how to restrict a multivariate function to a linear subspace. This is a useful technique in many situations, including visualizing an objective function that is constrained by linear equalities. For example, the graph to the right is from a previous article about how to evaluate quadratic polynomials.
What is an efficient way to evaluate a multivariate quadratic polynomial in p variables? The answer is to use matrix computations! A multivariate quadratic polynomial can be written as the sum of a purely quadratic term (degree 2), a purely linear term (degree 1), and a constant term (degree 0).