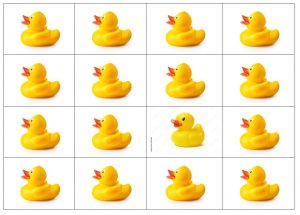
They look the same, don’t they? It can be hard to tell one duck from another, but one of them is from a bad egg (I’ll tell you which one at the end of the article).
Business rules are a bit like this. They find you lots of alerts, but like the ducks, they can all look the same. After all, they triggered the same rule. In many fraud departments, creating alerts, business rules or sometimes red flags can have false-positive rates in the range of 50 to 1 or 100 to 1. It is down to the skill and experience of investigators to find the relevant alert out of all the alerts presented to them.
Let’s make it more concrete with an example. Say we had a team of 50 fraud analysts, working 8 alerts a day, with a false positive rate of 1 fraud in 100 alerts (i.e., 1% fraud). What would this mean to the team?
- 46 of the fraud analysts would find zero fraud during the day.
- 4 would find 1 fraud.
- < ½ would find more than 1 fraud (rounding errors).
3 issues with low false-positive rates
The main problems with low rates include:
- Inefficient use of skilled investigators.
- Most of the analysts are being trained NOT to find bad alerts because they know that it is quite rare.
- Finding the one case of fraud is hard. It looks the same as all the other alerts. I call this the fraud investigator efficiency problem because investigators become less efficient when there is a high false-positive rate.
So that’s the problem – but what’s the solution? In a way, it’s easy: Provide alerts with a better false-positive rate. Except it’s not quite that simple, or we’d have done it already.
How can we improve the outcome?
This is where analytics and graph theory can help. Analytical models can greatly improve upon the selection of alerts, and they tell you how good they are, by scoring their work on data they haven’t seen before, but for which you already know the answer (a validation and/or test sample). So a model might tell you that there is a 50% chance that this alert is bad, and it might also tell you when, like your business rule, it’s 1 in 100. This should give investigators a boost to their efficiency. Such analytical models can use a whole range of factors, from internal and external data sources to unstructured data including text and images.
Again, let’s make this into a real example and put some numbers behind it. We have the same team of 50 fraud investigators with 8 alerts a day, but this time a false-positive rate of 1 in 10 (i.e., 10%), with analytics. What does this look like?
- 22 fraud investigators would still find zero fraud during the day.
- 19 would find 1 fraud.
- 7 would find 2 frauds.
- 2 would find 3 or more.
A much-improved outcome. And models can provide additional insight for why the alert has been flagged so this can guide the investigators in their questioning and what other data/documents to examine.
How is it all connected?
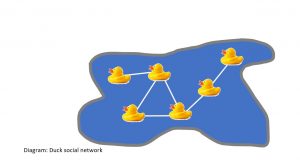
Fraudsters, like ducks, hang around in social groups and share and reuse many of their identities, locations, contact details and devices. This is where we use the relationships between our alerts. Typically, these will consist of hard links, such as email addresses, telephone numbers, device IDs and so on. Soft links include names and addresses, which are more easily manipulated. For example, Bob Smith, 1 High Street, AnyTown versus Robert Smith, ‘Rose Cottage’, High Street, AnyTown. Some entities can fall somewhere between the two, e.g., IP addresses, which can be shared (e.g., within a large organization) or only valid for a period (broadband providers only lease an IP address to your home for a period).
Once we’ve created our network, we can apply our business rules, models and graph theory to find those networks of interesting cases. Investigators like these networks as it shows the context of the latest alert, how it first started and any evidence of identity manipulation. False-positive rates can tumble if we can find a pattern of repeated behaviors that confounds the laws of probability, for example:
- Synthetic identities: 3 out of 5 people born on first of the month – 1 in 2,900.
- Staged accidents: 4 out of 5 accidents occurring at night (based on 1 in 5 accidents at night) – 1 in 150.
Using graph theory
Graph theory can identify, particularly in larger networks, key influencers and subgroups within a network, and maybe a pecking order of seniority (pun intended).
This approach can yield significant improvements, and false-positive rates of 1 in 4 are not uncommon. You may also find links to known frauds that were perhaps undetected previously. For our 50-strong fraud investigator team, what would this look like (with a 1 to 4, or 20%, fraud rate)?
- 8 fraud investigators would still find zero fraud during the day.
- 17 would find 1 fraud.
- 15 would find 2 frauds.
- 10 would find 3 or more.
Ultimately, analytics is about helping investigators stop more fraud and save organizations money. I think it also makes an investigator's job more interesting as they’re more likely to be working with real frauds.
P.S. Which duck was the odd one out? Row 3, column 3. Happy hunting!
For more on how SAS works in fraud across the public sector visit our webpage: www.sas.com/uk/gov/fraud.

