In my previous blog post, I introduced the “four pillars of trust” for automated decisions. The key takeaway was that explainability and transparency refer to the entire analytical process. But what about the “black box” of machine learning algorithms? Here, too, the analytical platform must guarantee transparency.
The good news is that algorithms are not that dark. Although we cannot derive easily understandable sets of rules, we can – regardless of the concrete procedure – investigate the decisive factors in the algorithmic decision. The field of research dealing with this kind of explainability is called fairness, accountability and transparency in machine learning (FAT/ML).
What makes a good algorithm?
Models should not only be good, but also interpretable and fair. What does that mean exactly? You must answer the following questions:
-
- Has the machine learning model adopted any abnormalities in the training data? Whoever selects or controls the data already substantially determines the learnable connections. For example, Microsoft's chatbot Tay has gone from being a “friendly guy” to a “hater” through targeted user interactions. And in the Norman project, MIT researchers trained a learning algorithm to become a psychopath through targeted data selection.
- Are important correlations properly mapped in the data? Can everyone rely on the learned model? The model may work well when applied to the training data, but are the detected correlations general enough to be transferred to new data?
- Is the model nondiscriminatory? For example, in markets like the EU, an insurance company may not use the characteristic “gender” or strongly correlated characteristics for pricing. And this is not the only problematic way of distinguishing stakeholders. Do I get the less favourable tariff or the more expensive credit because I have the wrong first name? Am I not getting the job because I have the wrong sex? There may be strong structural and cultural bias in data, which algorithms learn and even reinforce.
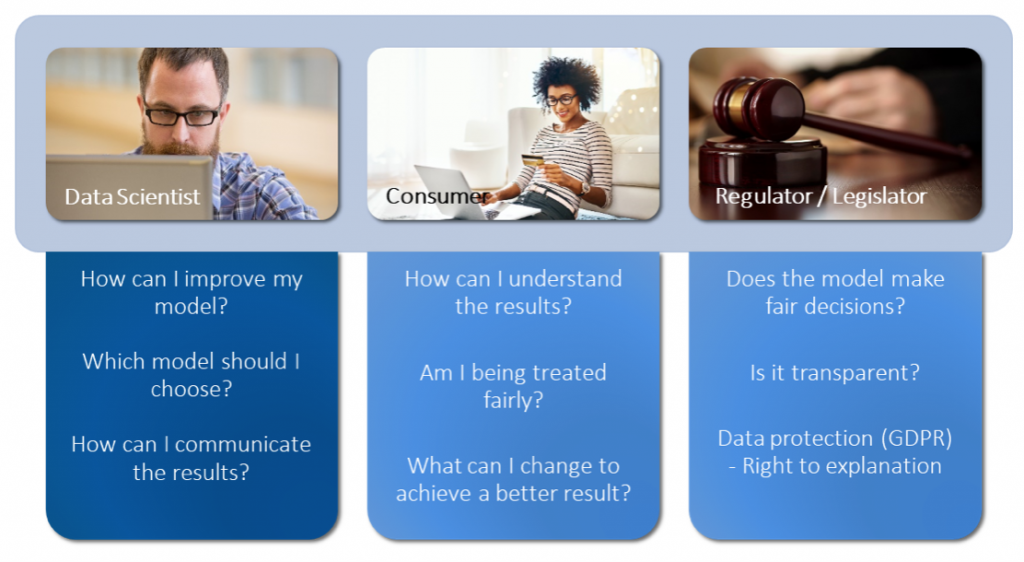
These and similar questions are important in different ways for companies, consumers, authorities and legislators, as the following figure shows.
 How can we investigate the black box of an algorithm?

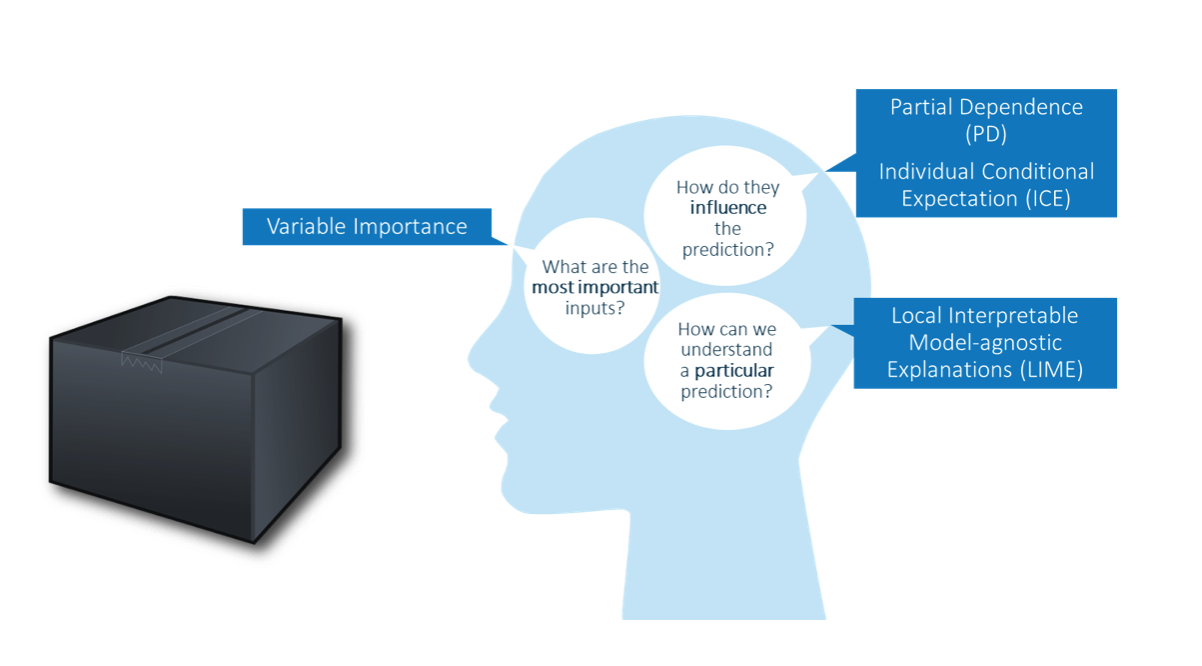
As indicated above, this is a current field of research. The following diagram summarises some approaches to explaining the effectiveness of algorithms. It is important that all these diagnostic procedures are independent of the specific machine learning algorithm (i.e. model-agnostic).
Let's take a closer look at Partial Dependence (PD) to see how these diagnostic methods actually work. Suppose we have trained a model for a medical diagnostic application to determine the likelihood of the patient suffering from influenza based on patient characteristics.
Fever versus skin rash
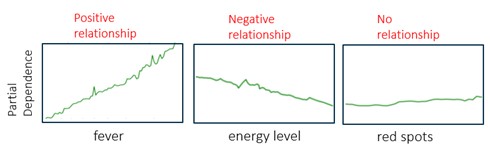
A PD diagram shows the functional relationship between the individual model inputs (e.g., fever, energy level and red spots) and the predictions of the model. A PD diagram also shows how the model's predictions depend on the values of the input variables of interest, taking into account the influence of all other characteristics. Thus fever in the diagram below has a strong positive influence on the likelihood of flu, a slightly negative influence on patient energy level and no influence on the rash.
To produce these graphs, we need to determine the average probability of influenza as predicted by the model in question for all possible values of the input under investigation while varying the other inputs.
To generate the PD graph for “fever,” the respective prediction model is fed several times with a certain fever value (e.g., 36.2 degrees Celsius) and a random variation of all other characteristics. The average value of the model predictions (i.e., the probability for the flu diagnosis) is entered as the PD value for fever = 36.2. This is now repeated for all fever values (36.3; 36.4; 36.5; ...), resulting in the green line in the graph. This finally shows us the influence of “fever” with simultaneous consideration of all other characteristics.
As this procedure shows, we don't have to completely dismantle the model. It doesn't matter how it is structured inside and how it is algorithmically created. With Partial Dependence, we have a diagnostic tool that can make a special aspect of machine learning algorithms transparent.
Incidentally, this and other procedures are already included at SAS.
Controlling Pandora's box
This is the conclusion of my short blog series. Everyone who automates processes and decisions with AI must deal with the ethical aspects – for moral, regulatory and practical reasons. After all, no company wants bad results to negatively affect its image. Explainability and transparency refer to the entire analytical process, not just to an algorithm of machine learning that automates a decision. But even machine learning algorithms are not a closed black box forever. “The algorithm made me do it” can never justify the consequences of using AI. It is trust and transparency that remove barriers to the use of AI – to the benefit of consumers, legislators and companies that use data analytics.
Watch the webinar: Implementing AI Systems with Interpretability, Transparency and Trust