Life phases
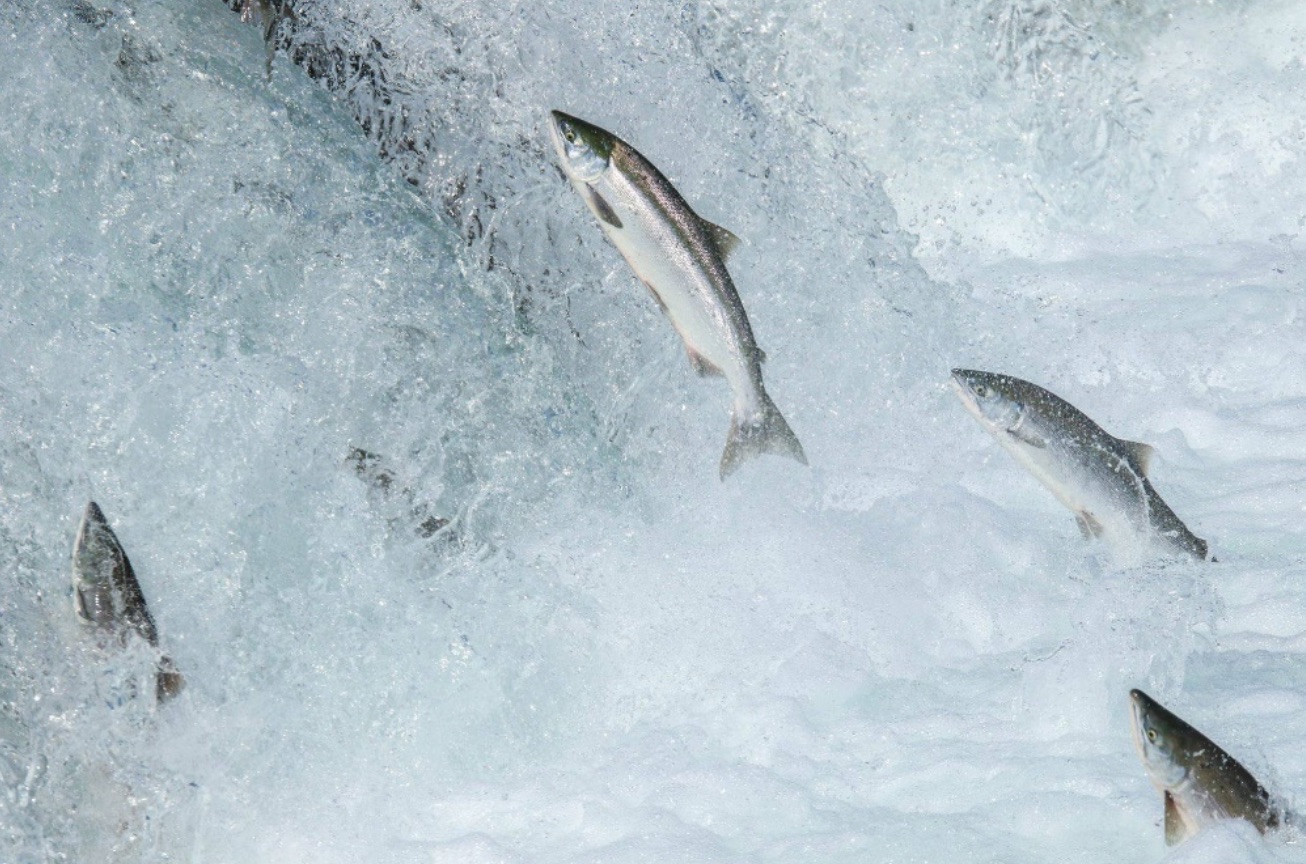
Wild salmon spend the first phase of their lives in rivers, developing through stages as they make their way downstream to the estuary. Here they embark on the second phase of life, swimming in the open ocean and eventually returning to the river to spawn.
 Analytical models are created in a data lab or sandbox where they are refined and tested under controlled conditions. Once the model is sufficiently mature, it is released into the production environment, where it spends the second phase of its life processing full volumes of data on a daily basis for automated decisions at scale. At some point, the model may be returned to the data lab for re-evaluation and retuning, or perhaps retirement and replacement.
See the similarity? Models and salmon both have a multistage life cycle in two distinct phases and have to migrate between two environments.
The analytics life cycle
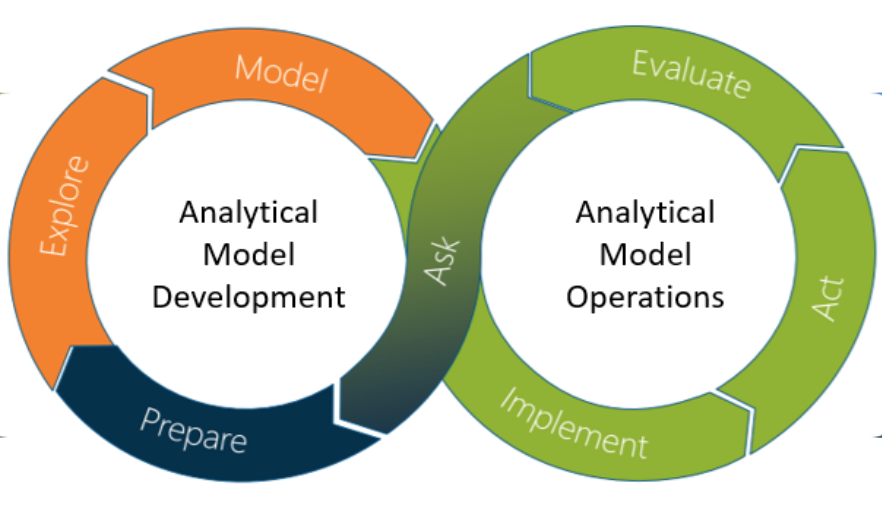 The analytics life cycle is a never-ending process that we can represent as a continuous loop shaped like an infinity symbol. You will see there are interlocking circles for the two phases: analytical model development and analytical model operations. These mirror the phases of the salmon’s life cycle moving from rivers to the ocean. The first phase is in a restricted environment used to test hypotheses and develop models. Once the model is sufficiently robust, it is released into the operational environment for large-scale batch processing or real-time decisioning at scale.
The diagram closely resembles a DevOps process, showing the stages in developing an application and moving it to production. Elements of DevOps are relevant in the analytical life cycle as we want a fast and efficient way of deploying analytics. However, we require a broader collaboration between business (data science) and IT, going beyond the partnership between IT development and operations functions.
The 7 life cycle stages
As with the Pacific salmon, the analytics life cycle has seven stages:
| Ask Questions & Define the Problem |
This stage is about understanding the business, scoping the problem and setting the requirements. |
| Prepare Data |
Usually the most time-consuming stage. After gaining access to data you will need to resolve data quality issues and transform the data to be ready for analysis. |
| Explore Data |
You will search for relationships, trends and patterns in the data using interactive, self-service visualisation tools. This is also where you will develop and test hypotheses through rapid prototyping. |
| Model Data |
Models can be built interactively through a visual interface or by writing code, potentially in SAS, Python or R. |
| Implement Models |
The model and any associated code are packaged and deployed to the execution environment. |
| Act to Move Business Forward |
Now that the model is in production, it will be used regularly to support business processes. |
| Evaluate | This feedback loop monitors, evaluates and retrains the model. |
Data, discovery and deployment
You may have noticed the three colours in the life cycle diagram, allowing us to map the seven stages to a simplified model. This view is more suitable for mapping the life cycle to analytics platform capabilities, something I have explored in another post. These capabilities are necessary for an architecture to support AI.
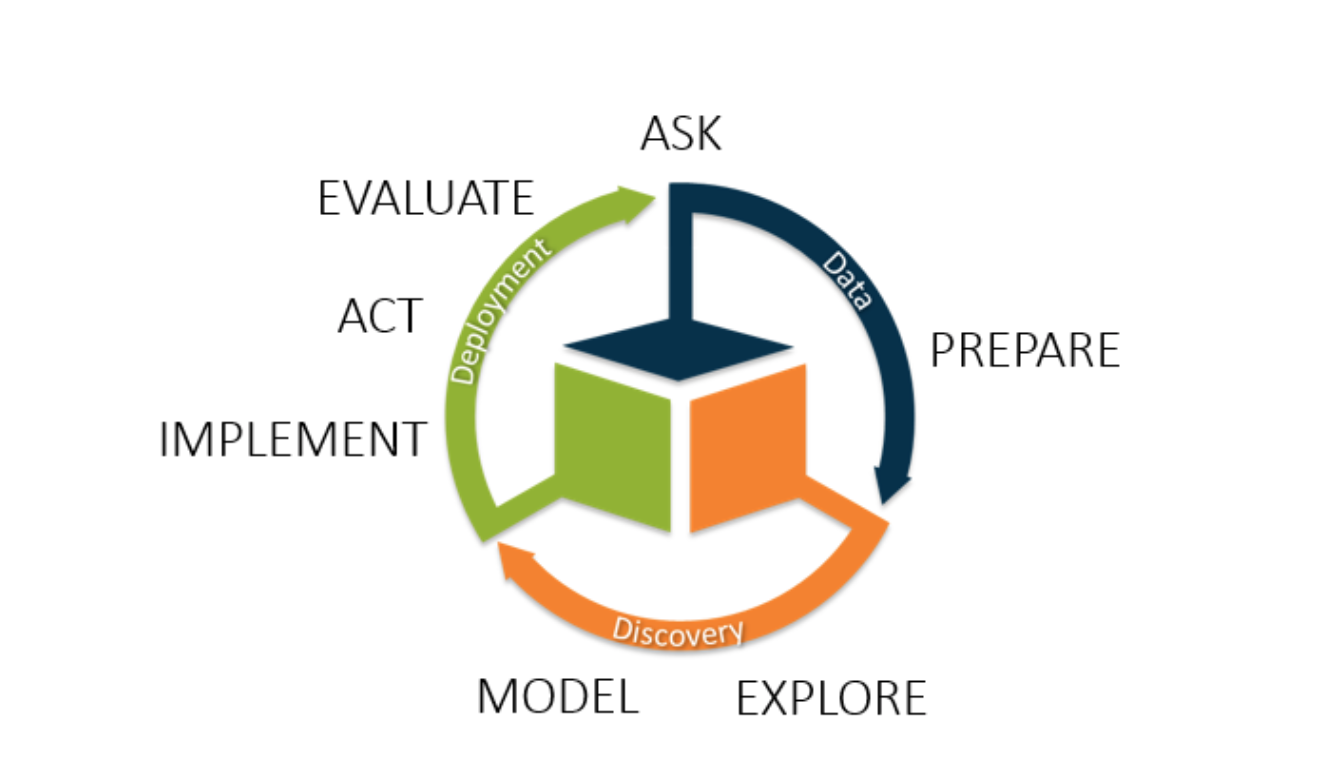 Data – Data access, data quality, data management, data preparation.
Discovery – Visual data exploration, predictive modelling.
Deployment – Open interfaces, scalability, high availability, real-time interactions.
The SAS Platform provides orchestration between these elements, supporting the governance of the analytics life cycle. It also maintains balance between the choice of tools and approaches and control of the production process and data access.
Environments
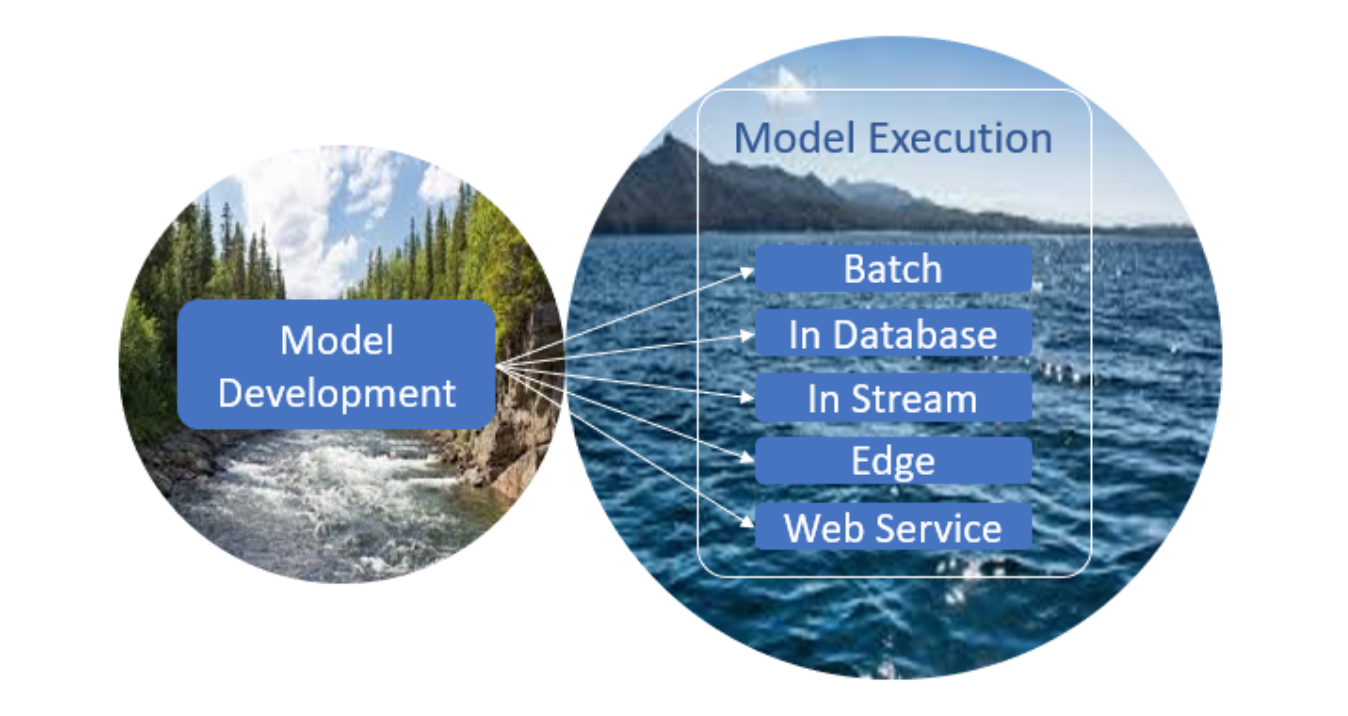
Salmon spend their lives in two natural, physical environments: rivers and ocean. Analytical models also require two environments, for development and operations, but we need to create these and establish a connecting route between them. They could be physically separate environments or logical separated areas on the same platform. The degree of separation required will depend on the balance between perceived risk and usability.
A Pacific salmon will always swim to the Pacific Ocean, but for an analytical model, there is a range of potential locations for the operational environment. They can be deployed to run in a batch process, in a database (using SAS Data Connect Accelerators), in a data stream (with SAS Event Stream Processing), on an edge device or as a web service.
Survival depends on the life cycle
The salmon naturally follows the life cycle. Its own existence and the survival of the species depends on it. Modern organisations now rely on analytics so fundamentally that their own survival depends on managing analytics effectively and following the analytics life cycle.
Image credit: Katmai National Park and Preserve provided under Creative Commons