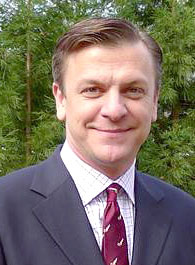
 Mark Wolff, Ph.D., consultant in SAS Health and Life Sciences Global Practice team, has spoken at health care conferences in several countries. His latest journey took him to Sweden and Denmark, and I met him when he had just delivered his key note at a conference at Karolinska Institut in Sweden.
Mark Wolff was overly exited about this experience at Karolinska, an organization that works to investigate how results from clinical research can be converted more rapidly into new and improved treatments related to the 4 diagnosis (type 2 diabetes, breast cancer, heart failure and arthritis).
-Imagine speaking to a room full of some of the the smartest and most influential people in health care. For example, my host was a past member of the Nobel Prize committee for Medicine and Physiology!, he told me.
The measurable aspects
The title of his presentation - The Quantum Patient - refers to measurable aspects of patient outcomes. Several from the audience came up to him to talk projects and exchange business cards after the presentation, so his messages must have been quite inspirational.
I asked him what had caught their interest, and he pinpointed a couple of areas:
- Statistics and data could and should play a bigger role in modern medicine
- The power of data visualization
- The ability to get started now
Let me try to give you an idea about his messages within these three areas - knowing that it will be impossible to capture it all in this blogpost!
Why data and statistics should play a bigger role in health care
Medicine is in fact a probabilistic science, and it has been predicted decades back that analytics and computers will change the way we practice medicine. A real change is still to be seen though. Some of the current trends that will help this development are:
- Availability of Massive Amounts of Data
- Commoditization of Computational Power
- Availability of High Performance Analytics
- Newfound Focus on Outcomes
During his presentation Mark Wolff also raised the question if it is actually unethical to make treatment decisions based solely on doctors’ opinions. The human mind can handle a limited set of parameters at the same time, and many studies have shown that mathematical models can dramatically improve a clinician’s ability to diagnose and treat complex diseases such as cancer.
Data visualization makes analysis easier and more exploratory
When you use data visualization to you don’t need statistical knowledge on the same level, you can actually see and understand the analysis results directly. This means that more people in more situations can make use of data analysis when making decisions.
Earlier visualization was mostly used to illustrate results (for example in a graph), meaning that it supported confirmatory analysis. With the latest technologies for big data analysis and visualization you can actually interact with a lot of data in a easy way. This is a major shift towards more exploratory analysis, which means that you do not only have the ability to confirm or invalidate a hypothesis. You can explore the data and find unexpected answers.
You can start here and now
One of the messages that Mark Wolff conveys when speaking at conferences is that you can use analytics to create value here and now. In health care there are lots of challenges in research and development (more data sources that could be shared across different sectors, data quality, standardization that is still not fully in place, etc.). Still there are lots of available data in good quality, especially in countries with a single payer government health care system like Denmark and Sweden, and when taking alternative data sources into account.
To illustrate his point he showed the results from a couple of his recent projects (using visualizations of course). Below you see the result of an analysis of side effects that were detected by analyzing patients’ own communication about side effects in social media. The analysis delivered insights on combinations of side effects over time (the actual visualization can be played as a video to see how it develops over time).
In conclusion there many opportunities within analytics, when working to improve outcomes research.
Health care is dominated by documents (clinical notes, etc.), so there is no doubt that text analytics, which gives you the ability to extract valuable information from unstructured data, will be a valuable source of knowledge.
When also taking into account that we now have the opportunity to analyze big volumes of data and communicate and explore the results more freely using visualization techniques, it will be interesting to see which advancements can be made that can actually improve patient safety and the quality of the treatment they receive at the hospital.
